

The Barracuda SSL VPN lets you monitor the performance of your Barracuda SSL VPN system including traffic and policy details, the subscription status of Energize Updates, as well as performance statistics, including CPU temperature and system load when using a hardware appliance.
Status and performance
The Status page displays information about the current status of the Barracuda SSL VPN server for the last 24 hours.
- Log into the SSL VPN Web interface.
- Go to the BASIC > Status page.
The status information is displayed as follows:
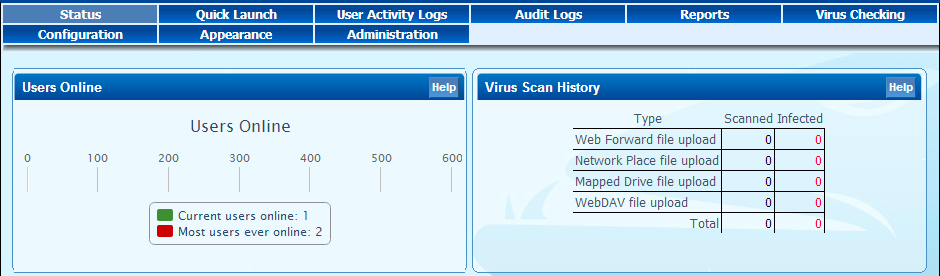
The graphs displayed on the Status page provide information about session types, user activity, resources and traffic sent through the Barracuda SSL VPN.
Session monitoring
The Sessions screen displays all active sessions of users that are currently logged in.
- Log into the SSL VPN Web interface.
- Go to the ACCESS CONTROL > Sessions page.
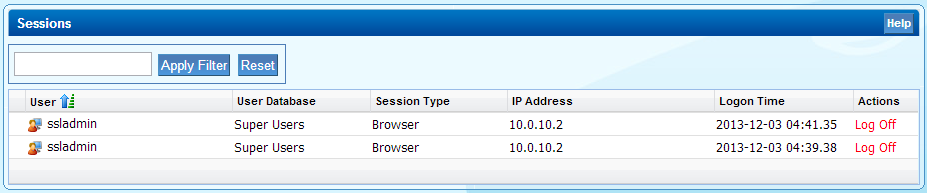
Expand a session by clicking + where applicable displays further details like launch time and traffic information. The Log Off option disconnects the user.
Viewing event logs
The User Activity Logs page displays all user-level events, whilst the Audit Logs page lists all system-level events. To access the event logs screens,
- Log into the SSL VPN web interface.
- Go to the BASIC > User Activity Logs page. For audit logs, select BASIC > Audit Logs.
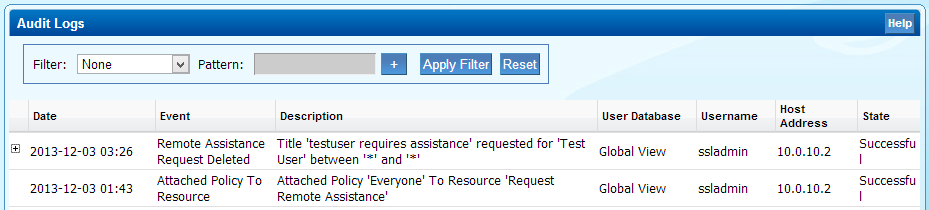
Click on the header of a column to sort by that column. You can also filter the list by selecting a category from the Filter drop down list.
System tasks overview
The Task Manager page provides a list of tasks that are in the process of being performed, and displays any errors encountered when performing these tasks, for example: imports of historical emails, exports of archived messages and configuration restoration. If a task takes a long time to complete, you can click Cancel next to the task name and then run the task at a later time when the system is less busy. The Task Errors section will list an error until you manually remove it from the list. To access the Task Manager page,
- Log into the Barracuda SSL VPN Web interface as the admin administrative user.
- Go to the ADVANCED > Task Manager page.
Web interface syslog
Supporting both IPv4 and IPv6 addressing with port numbers, the Syslog feature makes it possible to send all log information to a syslog server. To configure syslog settings,
- Log into the Administrative web interface.
- Go to the ADVANCED > Syslog page.
To monitor the Web syslog output, containing information regarding various events such as user login activities and configuration changes made from the administrative interface of the Barracuda SSL VPN,
- Log into the SSL VPN web interface.
- Go to the ADVANCED > Syslog page.
- Click Monitor Web Syslog.
SNMP support
The Barracuda SSL VPN offers the ability to configure the monitoring of various settings through SNMP, including traffic and policy statistics. For instructions on how to configure SNMP settings on the Barracuda SSL VPN, see SNMP.