

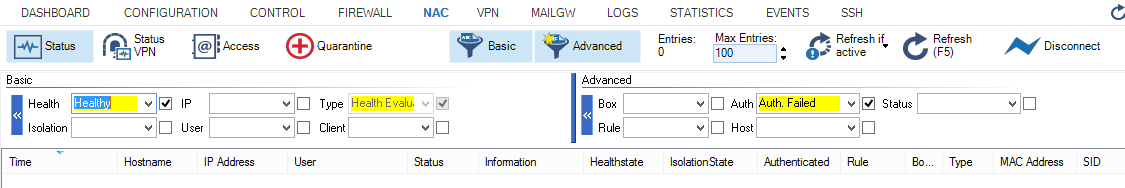
The Access Control Service of the Barracuda CloudGen Firewall provides real-time and historical information about the currently available endpoints and their status. Client system health assessments are carried out prior to initial connection and then periodically thereafter in order to detect changes in the client health state. To access the operational area of the Network Access Client on the CloudGen Firewall, open the NAC tab.
Available Columns
The lists in the real-time information window consist of the following columns:
- Time – Displays date and time of the last client access.
- Hostname – Displays the client's hostname as reported by the client.
- IP Address – Client's IP address as reported by the client.
- User – Either Local Machine if no user information is available, or the name of the logged-in user (DOMAIN\username).
- Status – Current status of the client. Possible values are Machine logged in, User logged in, or User logged off. Additionally, Out of time can be displayed if the client did not reconnect to the Access Control Service within the time period as configured in Access Control Service Settings > System Health-Validator > Health State Validity. This is often caused by powered-off clients or by interrupted network connectivity.
- Information – Summary of the client's health status or more details of a failed connection. Possible values include Client is healthy, or, if the client is unhealthy, the Information column contains details about the failed health checks. No rule matched, another possibility, means that identity matching failed.
Healthstate – Last health state, which can be one of the following: Healthy, Unhealthy, Probation, or Untrusted.
IsolationState – Possible values are Access, Not Restricted, and Probation.
Authenticated – Result of the last authentication, which can either be OK or Not OK.
Rule – Name of the matching policy rule.
Boxname – Originating unit that the Access Control Service runs on. This is only relevant in a CC Barracuda Network Access Client GUI context.
Type – Displays either Health Evaluator, Authenticator or Remediation, depending on the Access Control Service module that created the entry.
MAC Address – Client's MAC address as reported by the client.
SID – Client's local machine secure identifier (SID) as reported by the client.
Unit Monitoring and Real-time Information
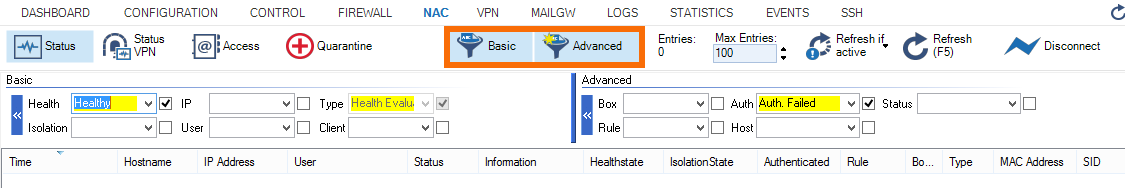
On the NAC page of the CloudGen Firewall, the following tabs are available for operational purposes:
Status Tab
The Status tab summarizes the health information of all connected clients. The Barracuda Network Access Client framework does not depend on continuously established connections; instead, clients connect periodically to the Access Control Service. Therefore, the Status tab can display historical information of the clients, too. To update the list, click Update List, since automatic updates are disabled.
As a primary key, the Barracuda Network Access Client uses the Microsoft Machine Secure Identifier (SID). The SID is a unique value that can change only in case of severe hardware modifications or re-installation of the operating system. This means that the Access Control Service can assign health states to the proper client even if the IP address changes or a user performs a logout.
The Status tab displays only the last health status of a client. To get an overview of historical information, e.g., in order to display different states for a client but cumulate states if they are identical, change the view to the Access tab.
Alternatively, the full log entries are available via the Log Viewer module. The full Access Cache can be viewed in Firewall GUI > Access Cache. Both log entries and the firewall access cache are only available if the Access Control Service is active on the Barracuda CloudGen Firewall unit. Barracuda CloudGen Firewalls do not sync their log files or the firewall access cache to the HA partner.
Status VPN Tab
This tab provides a subset of the information available in the Status tab. Only Barracuda Network Access Client Client connections established through VPN are enlisted. Manually applying filters to Status tab results provides the same information.
Access Tab
This tab provides all information available for the Access Control Service. This includes health information (also displayed in the Status tab) as well as data generated by the remediation module and the authenticator module.
Quarantine Tab
This tab provides all information regarding quarantined clients whose health state is unhealthy.
Filtering Functions
The filter categories are split into Basic and Advanced filters. Depending on the currently selected tab, some filters are not available or set as preselection.
To activate a filter, refresh the list. Filters are case sensitive. For manual input, wildcards ( * and ? ) are available. For example, 10.0.8.1? filters for IP addresses 10.0.8.10 to 10.0.8.19, whereas 10.0.8.1* also matches 10.0.8.100 to 10.0.8.199.
The Basic Filter provides the following filter criteria:
- From /To – Restricts the time period for which entries should be listed.
- Health – Provides the health states of Healthy, Unhealthy, Probation, and Untrusted to display only the selected entries.
- Isolation – Categories Not restricted, Restricted, and Probation are available as filter criteria.
- IP – Filters for specific IP addresses.
- User – Filters for specific user entries.
- Type – Filters for the entries Health Evaluator, Authenticator, or Remediation, depending on the Access Control Service module that created the entry.
- Client – Filters for entries of Local Machine, VPN, or User types.
The Advanced Filter provides the following criteria:
- MAC – Filters for the MAC address of the client. Since it is sent by a client, the original MAC address will be available even in routed environments.
- SID – Filters for a Microsoft machine SID.
- Box – Filters for the originating unit the Access Control Service runs on (only relevant in a CC Barracuda Network Access Client GUI context).
- Rule – Matching policy rule.
- Auth – Filters for a certain authentication status.
- Host – Filters for a hostname.
- Status – Filters for a client status (User logged in, Machine logged in, Logged out, Out of time).
By activating the corresponding check boxes, you can combine multiple fields in order to achieve a more precise selection.
Context Menus
Right-click a list entry to activate one of the following context menus:
- Standard context menu – Accessible through the Tools item.
- Follow this Computer … – All entries within the selected client are displayed in a new tab. Criteria for identifying a computer is the computer's local machine secure identifier (SID).
Visualize this Computer … – This entry visualizes the health state of the selected client. The graphical status at the top of the main window displays the summarized health state per day. Selecting multiple entries displays statistics of clients in Unhealthy, Probation, and Healthy states.
For single entries, the summary displays a red icon to indicate an unhealthy client if it was unhealthy only once per displayed time period (day/week). Grey icons mean that no data is available for this date. This might indicate a client that is powered off.
Show Log File – Displays the log entries referring to the selected client. In addition, the access cache of the forwarding firewall can be displayed. Only log entries available on this Barracuda CloudGen Firewall box are displayed.
Show Details – Displays detailed information about the selected client in a list view.
Flush Cache – Removes either the selected entry, or, depending on selection, all entries belonging to the selected client. Can also remove all entries from the cache.
Ungroup – Displays all entries in a flat list instead of the default group view.
Group by – For better lucidity, status entries can be grouped by their essential attributes, such as time, IP address, or rule name. Entries are arranged in pop-up menus topped by a labeled title bar.
Summarize duplicate entries – Cumulates identical entries and, in addition, displays the count (for example, how many entries are cumulated).
Show time in UTC – Shows UTC time instead of the Barracuda CloudGen Firewall time zone.