

Benchmark Results enable you to look at click rates and login activity based on industry, email template used, and category. These benchmarking statistics can help you decide, for example, which type of template to use for your industry, based on their past click rate or login activity success with other organizations in your industry.
Industry categorization is achieved by using organizations' standard NAICS ( North American Industry Classification System) codes.
To work with Benchmark Results:
- Navigate to Results > Benchmark Results.
In the left panel, select appropriate filters, for example an NAICS Industry Sector or
Licensesto compare your results with those of organizations similar in sector or size.If you are running a Benchmark Campaign, specify the following filters in the left panel:
Benchmark Campaign – Select True.
My Campaign – Select True to display results from your organization only. By default, results from all organizations are displayed.In addition, you can specify the following filters:
- Category – The subject of the campaign.
- Click Rate – A range for the click rate percentage you want to view.
- Cutoff Date – A range for the cutoff date of the benchmark campaign.
- Licenses – A range of the number of Security Awareness Training licenses for organizations in the benchmark. Correlates with organization size, so you can compare your own organization to those with similar sizes.
- Login Rate – A range of login activity percentage rates.
- NAICS Industry Sector – One or more sectors you want to compare with your sector.
- Sent Count – Range of number of emails sent, providing insight into the size of an organization.
- Email Template Name – The name of the benchmark campaign you are running. For example, 202004.
Select tabs to see results:
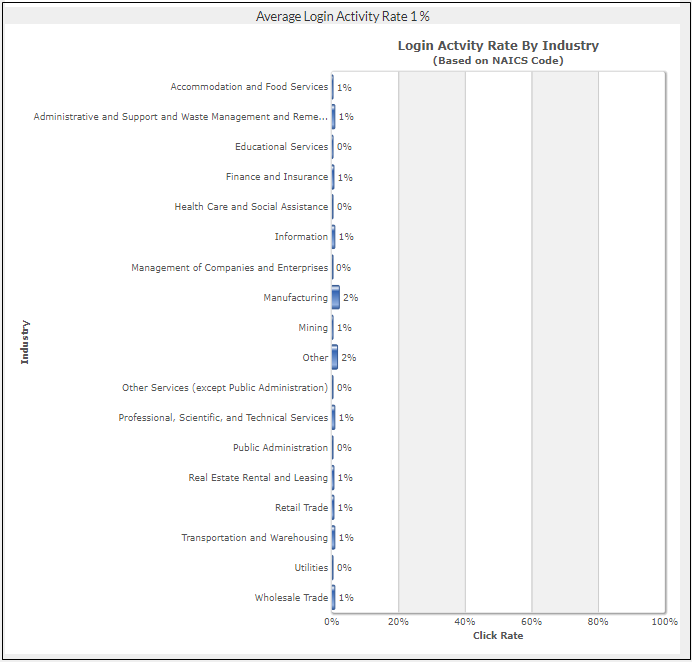
Click Rate by Industry displays click rate of all campaigns by NAICS industry sector, like
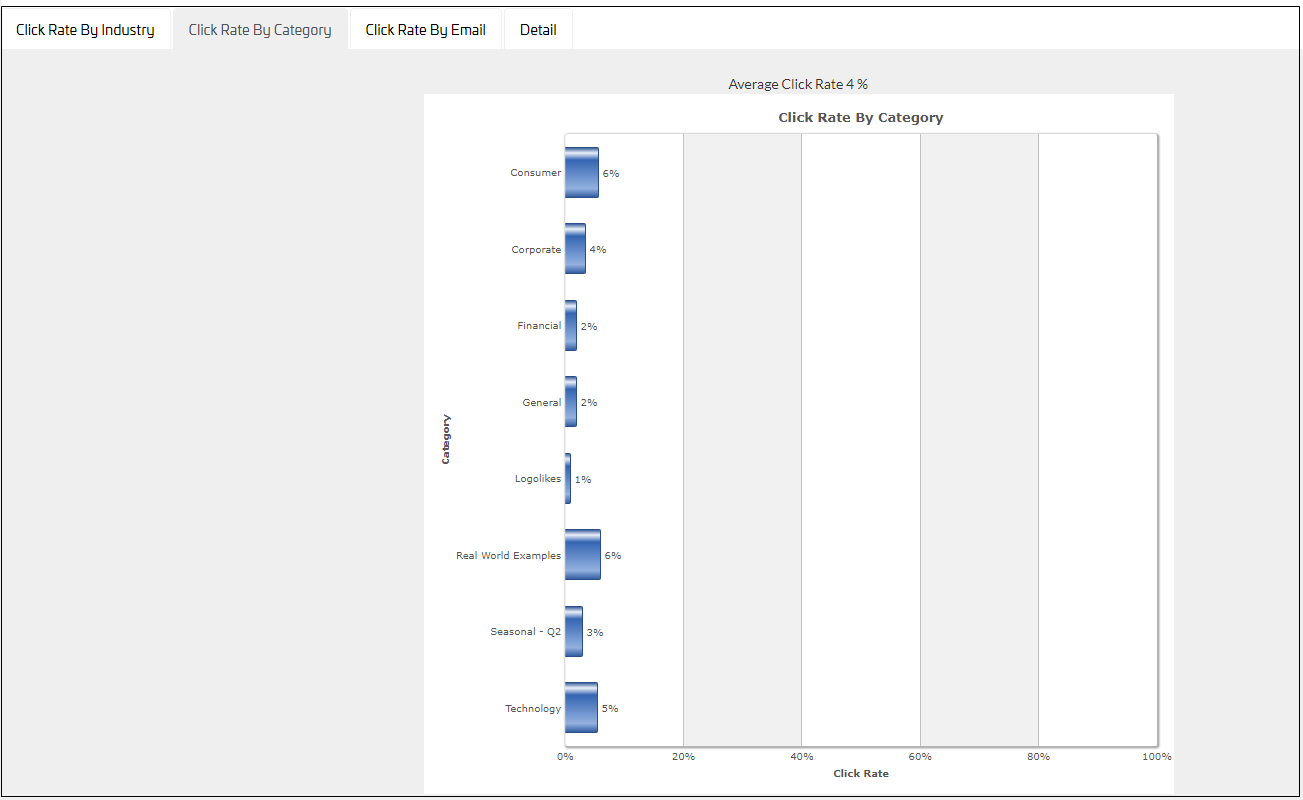
Information, orHealth Care and Social Assistance.Click Rate by Category displays click rate of all campaigns in all sectors, by category or email template category, like
General,Technology, orCorporate.Click Rate by Email displays click rate in all sectors, in all categories, by specific campaign, like
Holiday CardorOnline Bank Security Notice.Detail tab displays an overview of the results.