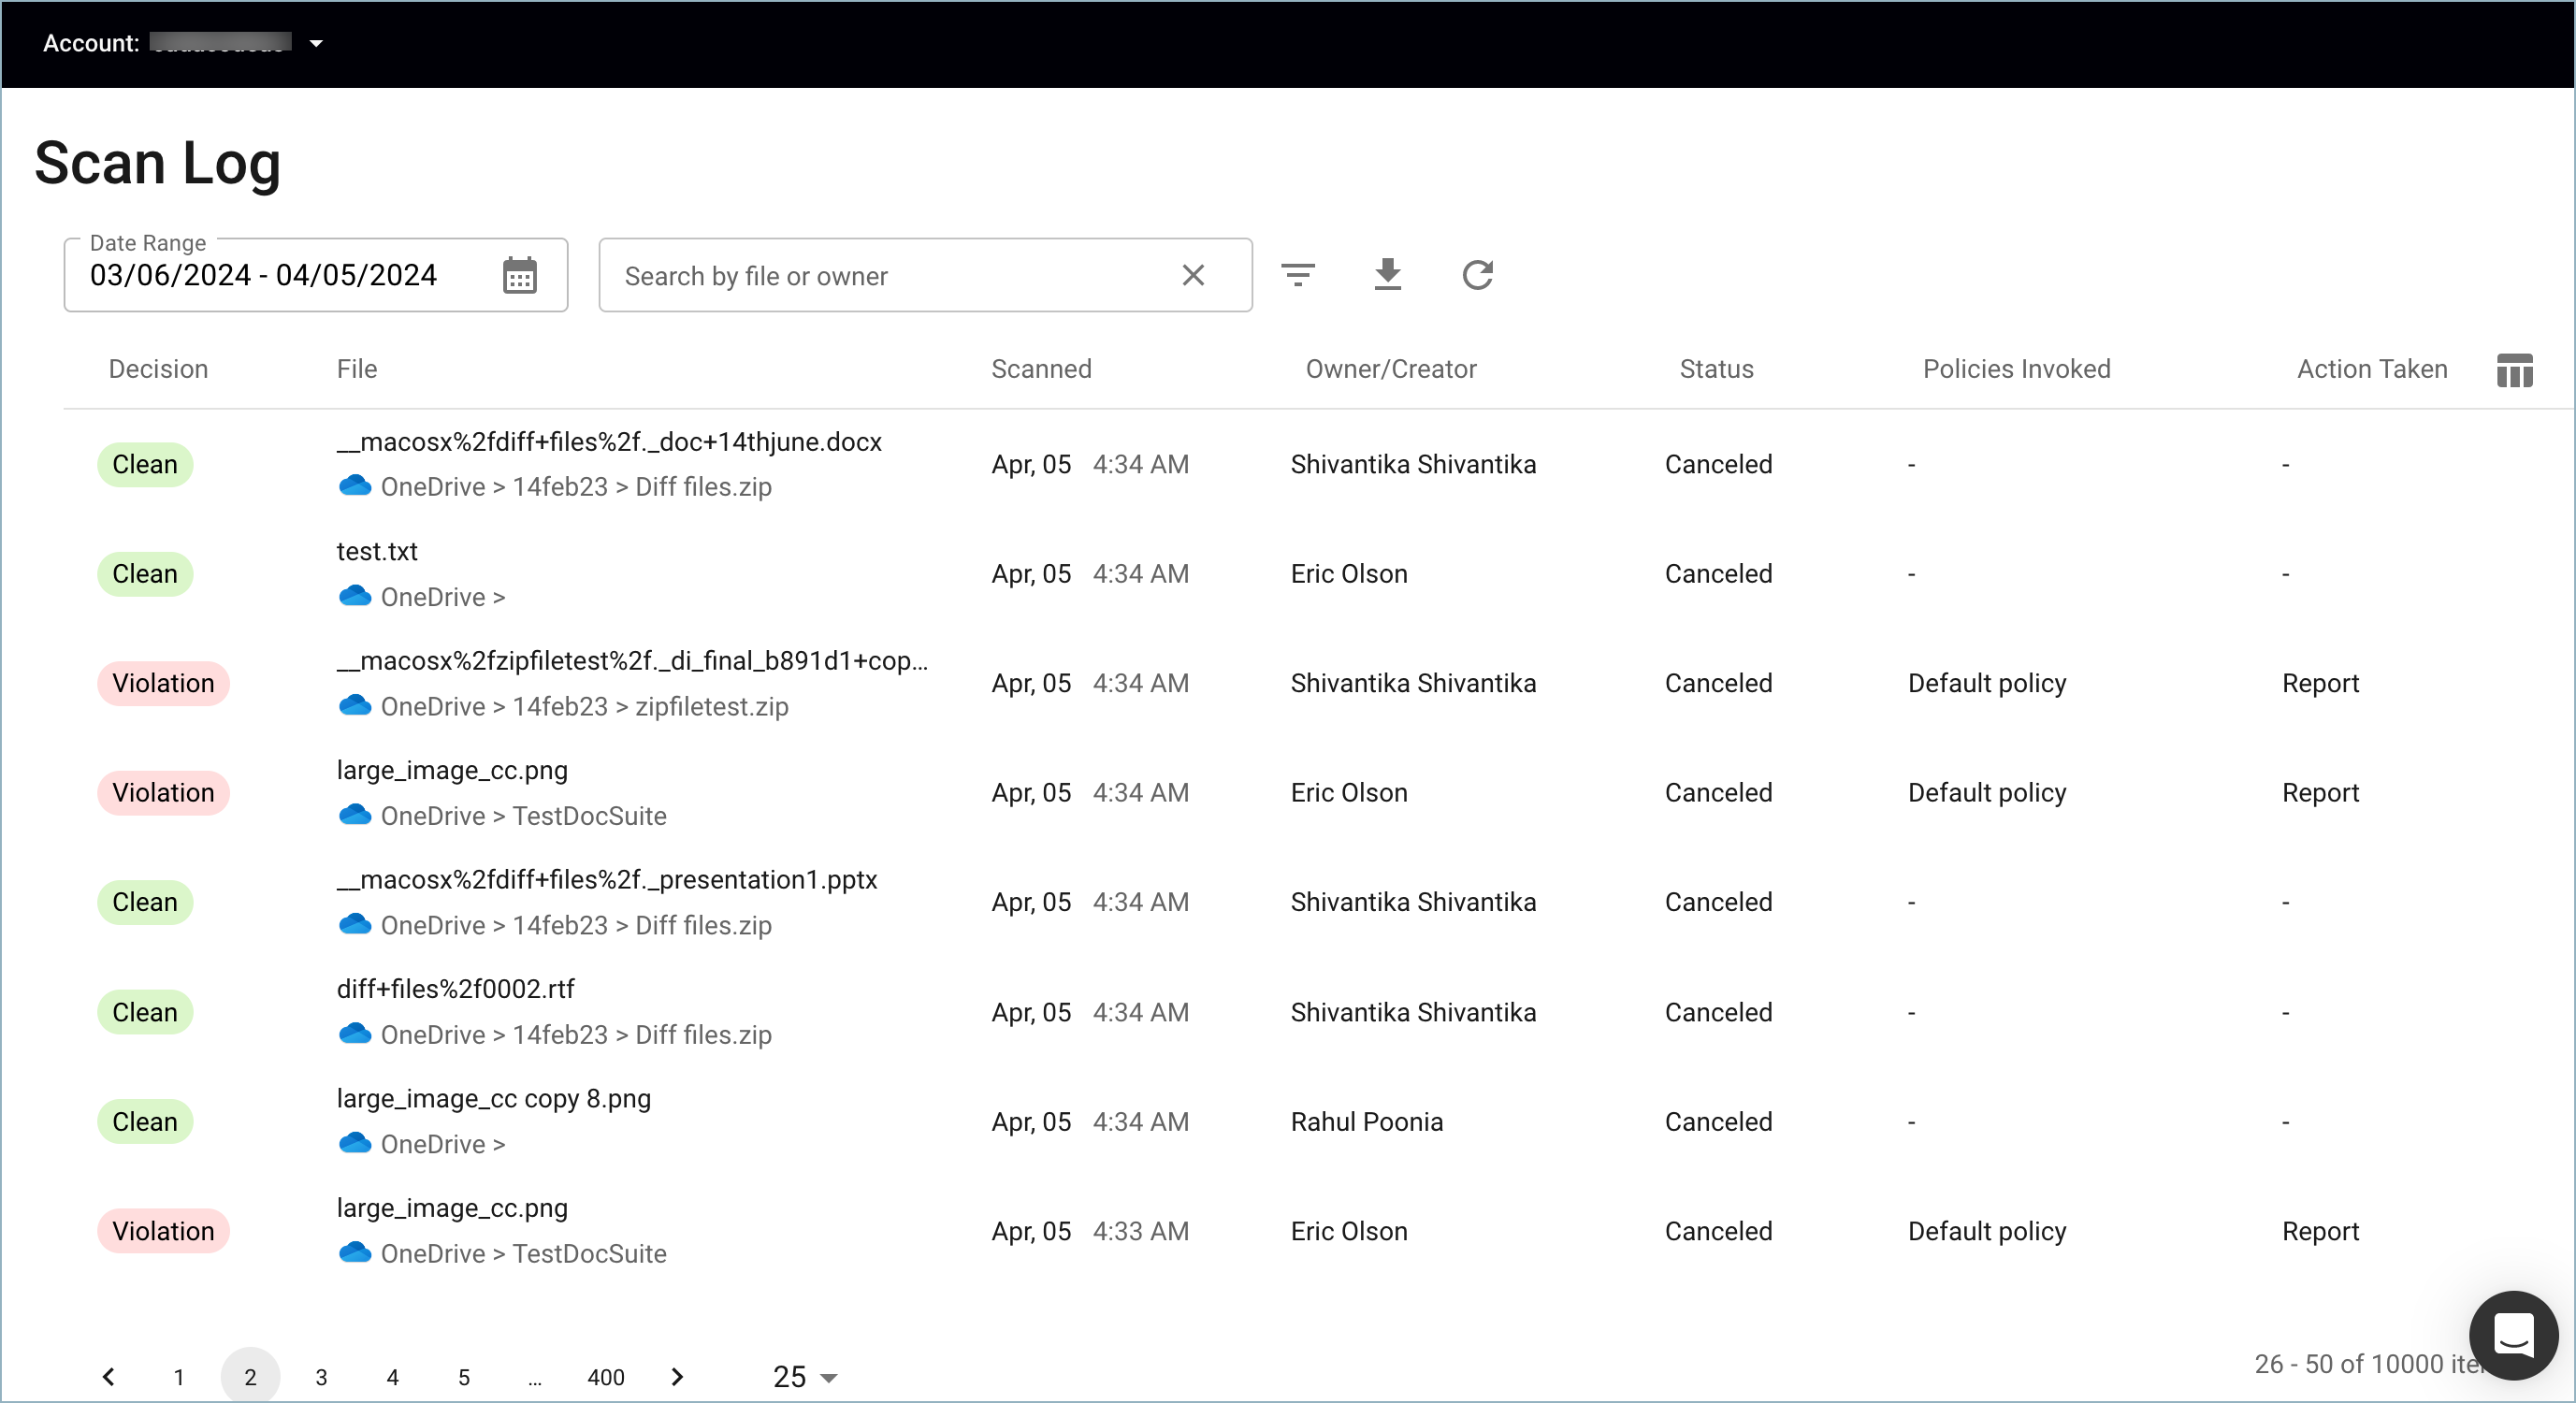
The Scan Log shows every action taken on each file, whether by the Barracuda Data Inspector or an admin remediation. Records are retained and available for 90 days. Up to 10,000 can be displayed at any one time.
Enter a file name in the search field to see each scan made by the Data Inspector on that file including any final actions taken (Quarantined, Deleted, etc.).

Filtering Page Results
There are multiple tools to help limit the items displayed to only those you are interested in.
Sort by Column
Click the top of the File, or Scanned columns to sort. File will sort by file names alphabetically. Scanned is the default and sorts most recent to least recent. Clicking a second time on a column header will reverse the order (i.e. least recent to most recent).
Search Box
Add text to the search field to find a file name, file owner, or file creator match.
Filter Button
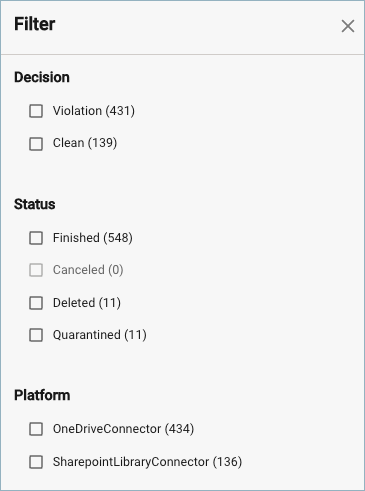
Click the Filter button![]() to open a list to narrow down search results. Select from Decision, Status, or Platform, options. (See below for descriptions of each.) Options with zero instances or those not compatible with options already checked are grayed out and cannot be selected.
to open a list to narrow down search results. Select from Decision, Status, or Platform, options. (See below for descriptions of each.) Options with zero instances or those not compatible with options already checked are grayed out and cannot be selected.
The filter options are:
Decision
Violation – File found to be malicious, contain sensitive data, or has a sharing violation.
Clean – No violations found during this action. Note: This doesn't necessarily mean the file no longer contains violations. For example: when an admin quarantines a file with a violation, no scan is run. Because no scan was performed, no violations was found and the file is marked as Clean for this action.
Status
Finished – File scanned.
Canceled – Scan failed to complete.
Deleted – File remediated as Deleted. See Detections to learn more about remediation.
Quarantined – File remediated as Quarantined. See Detections to learn more about remediation.
Platform
OneDriveConnector – Microsoft One Drive
SharepointLibraryConnector – Microsoft Sharepoint
Once a box is checked, a corresponding filter chip will appear under the search box. Filters can be removed by clicking the X next to one or clicking the Clear All link.
Date Range
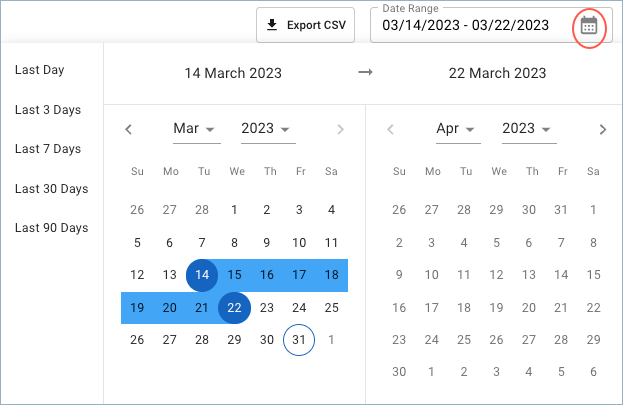
Limit page results to those that occurred in a given time period.
Click the calendar icon on the Date Range field to open the date range selector. Click on one of the built in presets at left (i.e. Last 3 Days, Last 30 Days, etc.) or select a range by clicking on the days in the calendar.

Other Detections Page Options
Click the reload icon![]() to view the latest Scan Log items. Note: any implemented text search, selected filters, or date ranges will be retained. To restore detection results to default, reload the browser window.
to view the latest Scan Log items. Note: any implemented text search, selected filters, or date ranges will be retained. To restore detection results to default, reload the browser window.
The Export CSV![]() button will export up to 10,000 Scan Log items and will be limited by any active searches, filters or date ranges.
button will export up to 10,000 Scan Log items and will be limited by any active searches, filters or date ranges.
Click the Select Columns icon![]() located at far-right to limit the columns displayed. Owner/Creator, Status, Policies Invoked, and Actions Taken can be added or removed. Decision, File, and Scanned always always displayed and cannot be deselected.
located at far-right to limit the columns displayed. Owner/Creator, Status, Policies Invoked, and Actions Taken can be added or removed. Decision, File, and Scanned always always displayed and cannot be deselected.
Click the back < or forward > arrows or one of the numbers at the bottom to view another page of Scan Log items. The number shown per page can be changed via the dropdown menu  .
.
