The SecureEdge Manager is the central management point of Barracuda SecureEdge. From here, you can manage all your edge services, sites, and appliances, and perform various configuration and maintenance actions. To access the Barracuda SecureEdge cloud web UI, go to https://se.barracudanetworks.com and log in with your existing Barracuda Cloud Control account. For more information, see Getting Started. To access the configuration elements, open the corresponding tabs and navigate through the left menu.
The Barracuda SecureEdge Manager, a cloud web UI provides the following main sections:
Dashboard
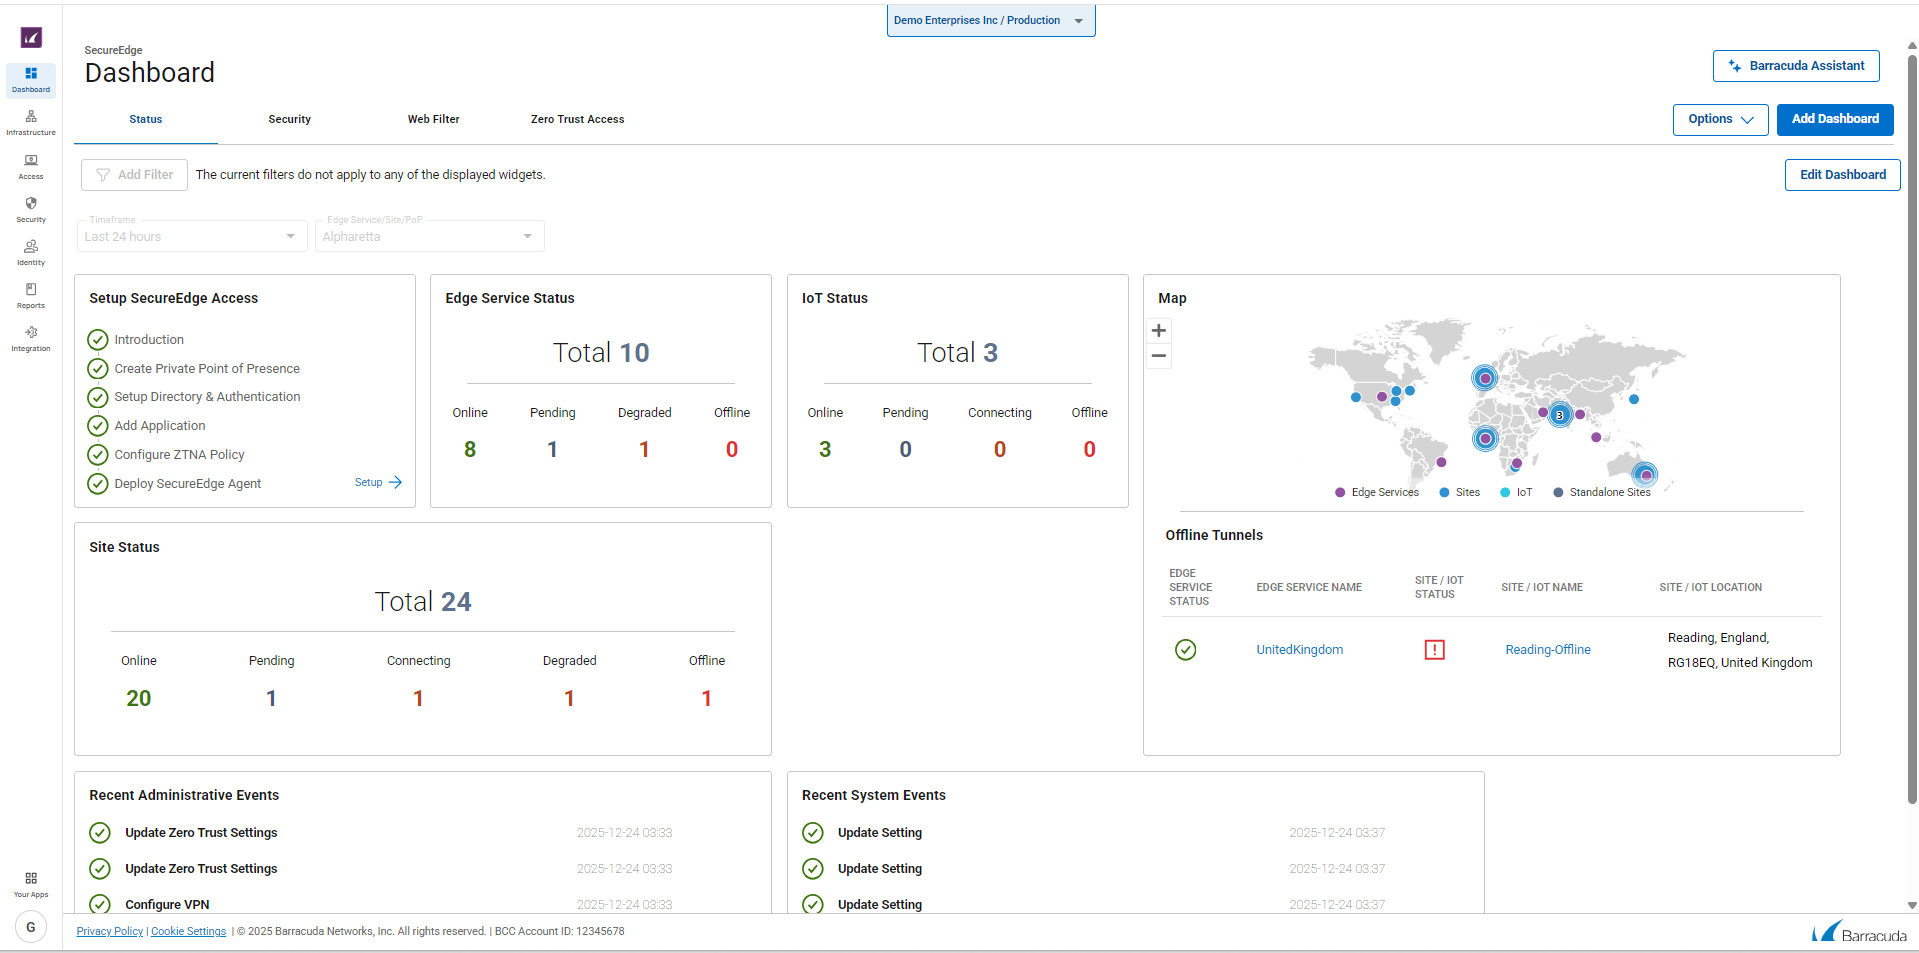
The Barracuda SecureEdge dashboard gives you an overview on web- and network traffic for connected sites and devices and provides aggregated data on SD-WAN tunnels and security information. Administrators can create their own workspace and customize the view on connected devices for which they want the dashboard to display information. To access information on the SecureEdge dashboard, click the Dashboard icon on the left.

For more information, see Dashboard.
Infrastructure
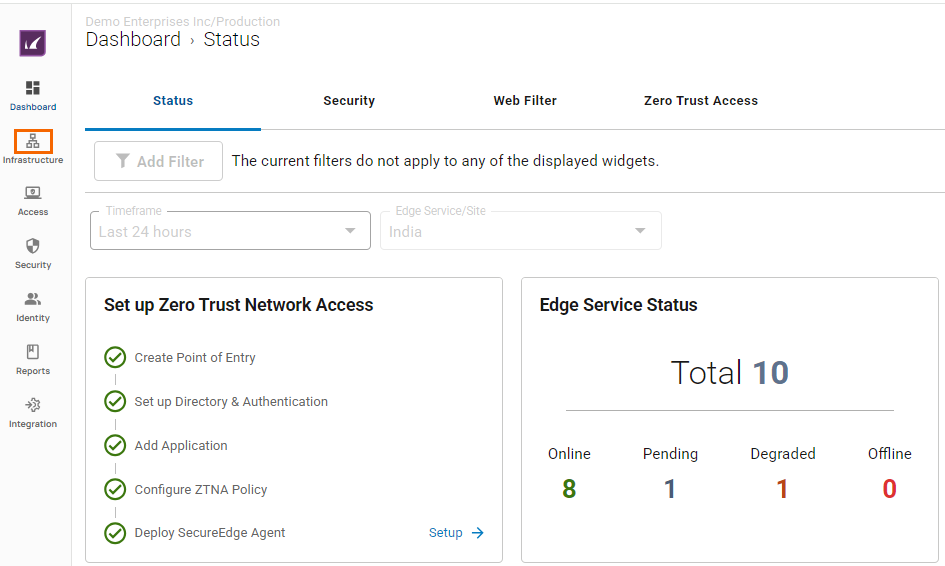
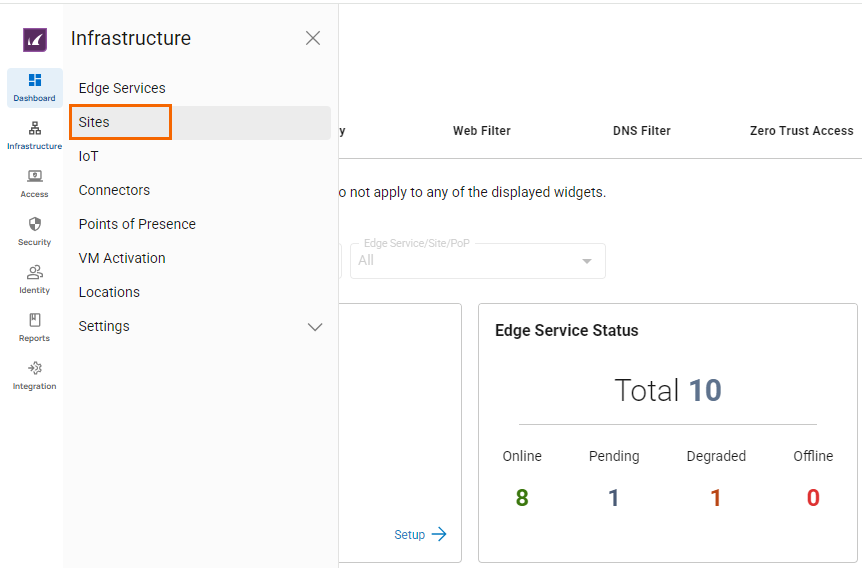
The Infrastructure tab provides an overview of all connected edge services, sites, Connectors, and IoT devices and lets you configure network settings and manage your connections. From this tab, you can also perform activation and update tasks. To access the settings, click the Infrastructure icon on the left and choose the appropriate configuration item from the navigation menu.

For information on how to connect and configure edge services, sites, connectors, and IoT devices, see Infrastructure.
Access
Barracuda SecureEdge offers Secure Service Edge (SSE) services, including remote access capabilities that secure access to resources regardless of location or device type. It forms an essential part of any Secure Access Service Edge (SASE) solution. To access the SecureEdge zero trust access configuration, click the Access icon in the left menu. You can enroll users, groups, or devices, manage authentication settings for users and groups, and configure Points of Presence (PoP). Alternatively, you can configure Private Points of Presence ( PoE) by selecting either an existing edge service, site, or firewall that the Barracuda SecureEdge Access Agent can connect to. You can also configure application catalog entries, to define applications to appear in the SecureEdge Access Agent app for quick access.

For more information, see Secure Service Edge (SSE).
Security
The Security page allows you to manage security settings such as web filter rule, IPS, malware protection, and SSL inspection, and configure SD-WAN policies. From here, you can also add, edit, and remove custom applications. To access the SecureEdge security configuration, click the Security Policy icon in the left menu and navigate through the settings.

For detailed information, see Policies.
Reports
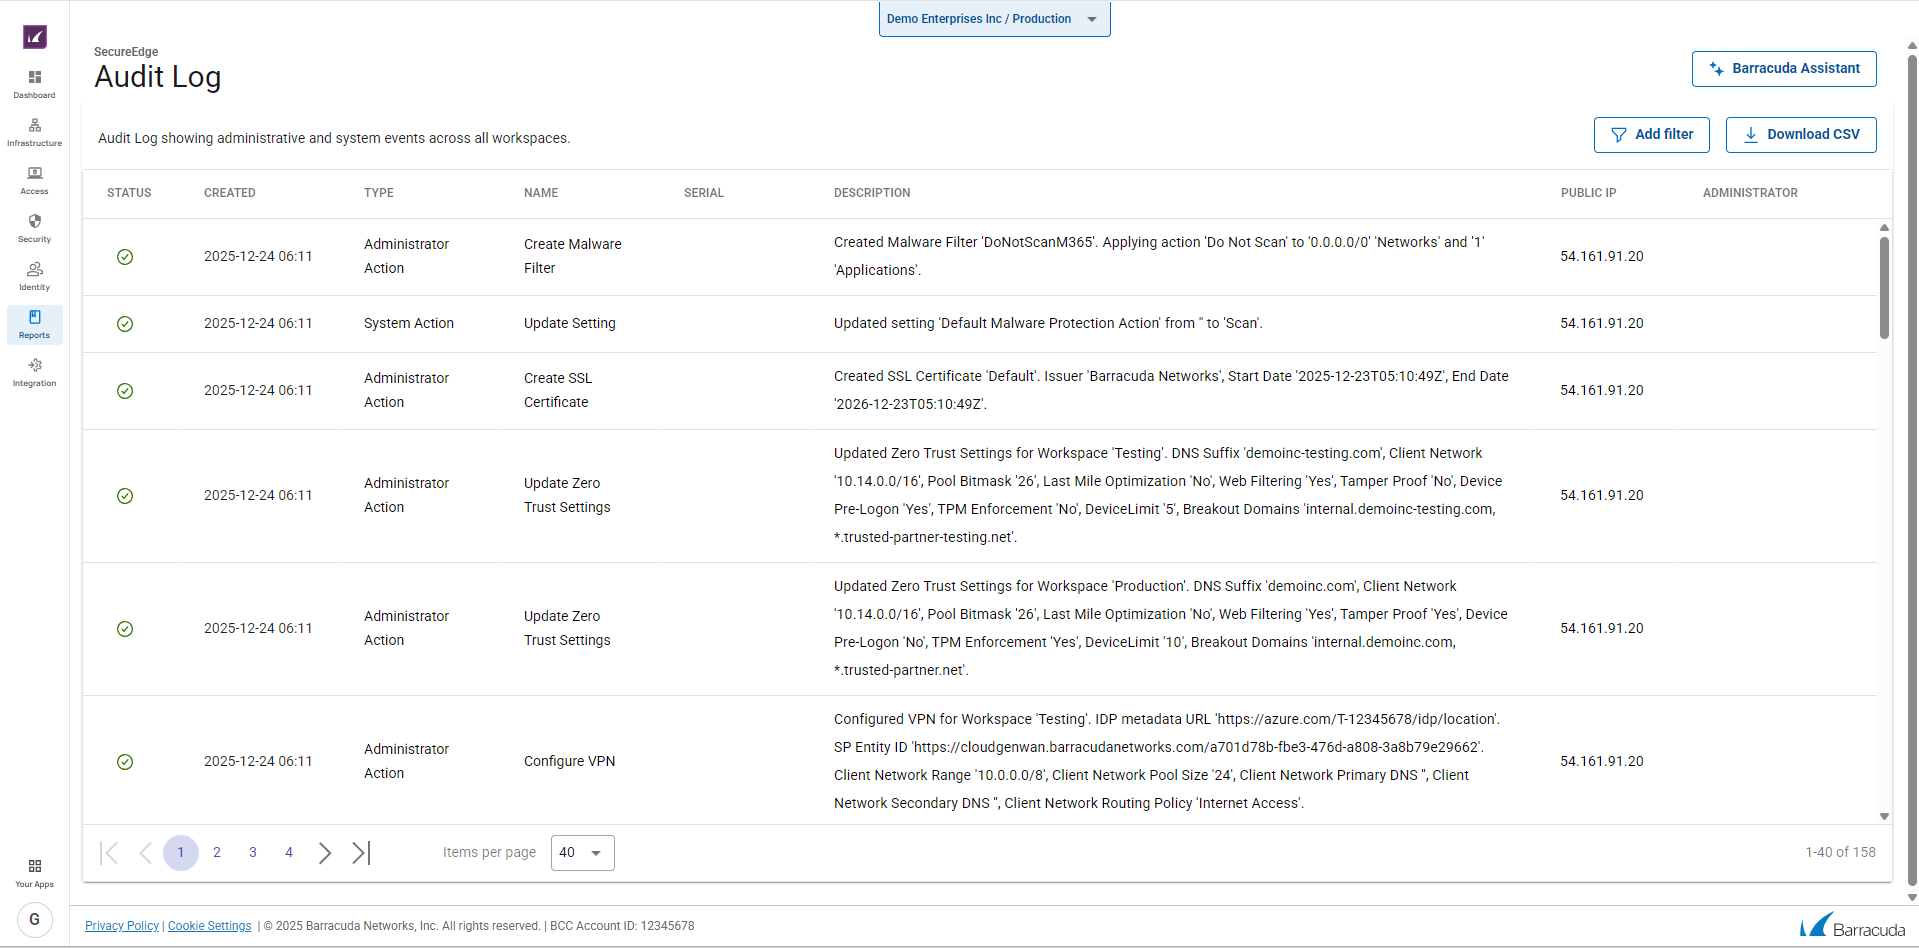
The Reports page provides information on actions performed by administrators and lets you configure email notifications and syslog streaming. From here, you can also configure log settings and create reports.

For more information, see Reports.
Integration
The SecureEdge Integration page allows administrators to connect CloudGen Firewalls to Barracuda SecureEdge. From here, you can also enable Azure Monitor, Barracuda XDR, and IPSec VPN. To access the Integration page, click the Integration icon on the left.

For more information, see How to Configure a Barracuda CloudGen Firewall in Barracuda SecureEdge and How to Configure Log Streaming to Microsoft Azure Log Analytics Workspace.
The SecureEdge Configuration Menu
Barracuda SecureEdge provides a user-friendly interface that gives you an overview on the configuration and shows information on connected Edge Services (gateways) and Sites. You can also create and customize your own dashboards. Use the navigation bar on the left to switch between tenants, workspaces, and configuration units. To access a configuration menu and related sub-sections, click the icon that represents the section, and choose the settings from the menu that becomes visible.
 |  |
To filter the content shown on a page, click Add Filter in the top-right corner of a page and select the criteria you wish to search for.

To reset the filter, click Clear Filter.
For more information, see the following:
Update windows – Updates
Log streaming – How to Configure Log Streaming to Microsoft Azure Log Analytics Workspace
VM Activation form – Virtual Systems (VTx) Deployment
Notifications – How to Create a Notification
