The PROXY tab provides access to the Fail Cache page and lets you monitor and manage fail-access cache entries that are generated by the HTTP Proxy service. To display this tab in the service bar, you must introduce the HTTP Proxy service. For more information, see How to Set Up and Configure the HTTP Proxy. When configuring the HTTP Proxy service, ensure that you select the Enable Fail Cache option.

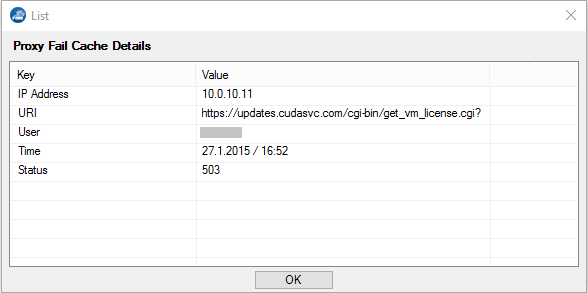
The PROXY > Fail Cache page provides information about the location, status, and time when the action was performed. To display the details, double-click an entry in the list.

The columns in the Proxy Fail Cache Details window provide the following information:
- IP Address – The IP address of the source.
- URI – The destination URL path.
- User – The user who performed the action.
- Time – The date and time when the action was performed.
- Status – The status ID of the process.
Managing Cache Entries
On the PROXY > Fail Cache page, you can view the details of each fail-access cache entry generated by the HTTP Proxy service. To manage the list, you can refresh the page automatically or manually, delete entries, and specify which columns are displayed or hidden. To filter the list, click the Filter icon on the top right of the page. In the Filter section, enter the details in the corresponding fields.
Right-clicking an entry in the list opens a context menu with the following options:
- Flush Cache – Select this option to remove an access cache entry or to clear the whole cache list.
- Ungroup – Select this option to ungroup entries that are grouped using the following Group by setting.
- Group by – To group entries by IP address, user, HTTP status, or time, expand this menu and select the appropriate check boxes.
- Show Time in UTC – Displays the time in UTC format.
- Tools – Provides the standard Tools context menu with the options to export listed entries to file or clipboard.
