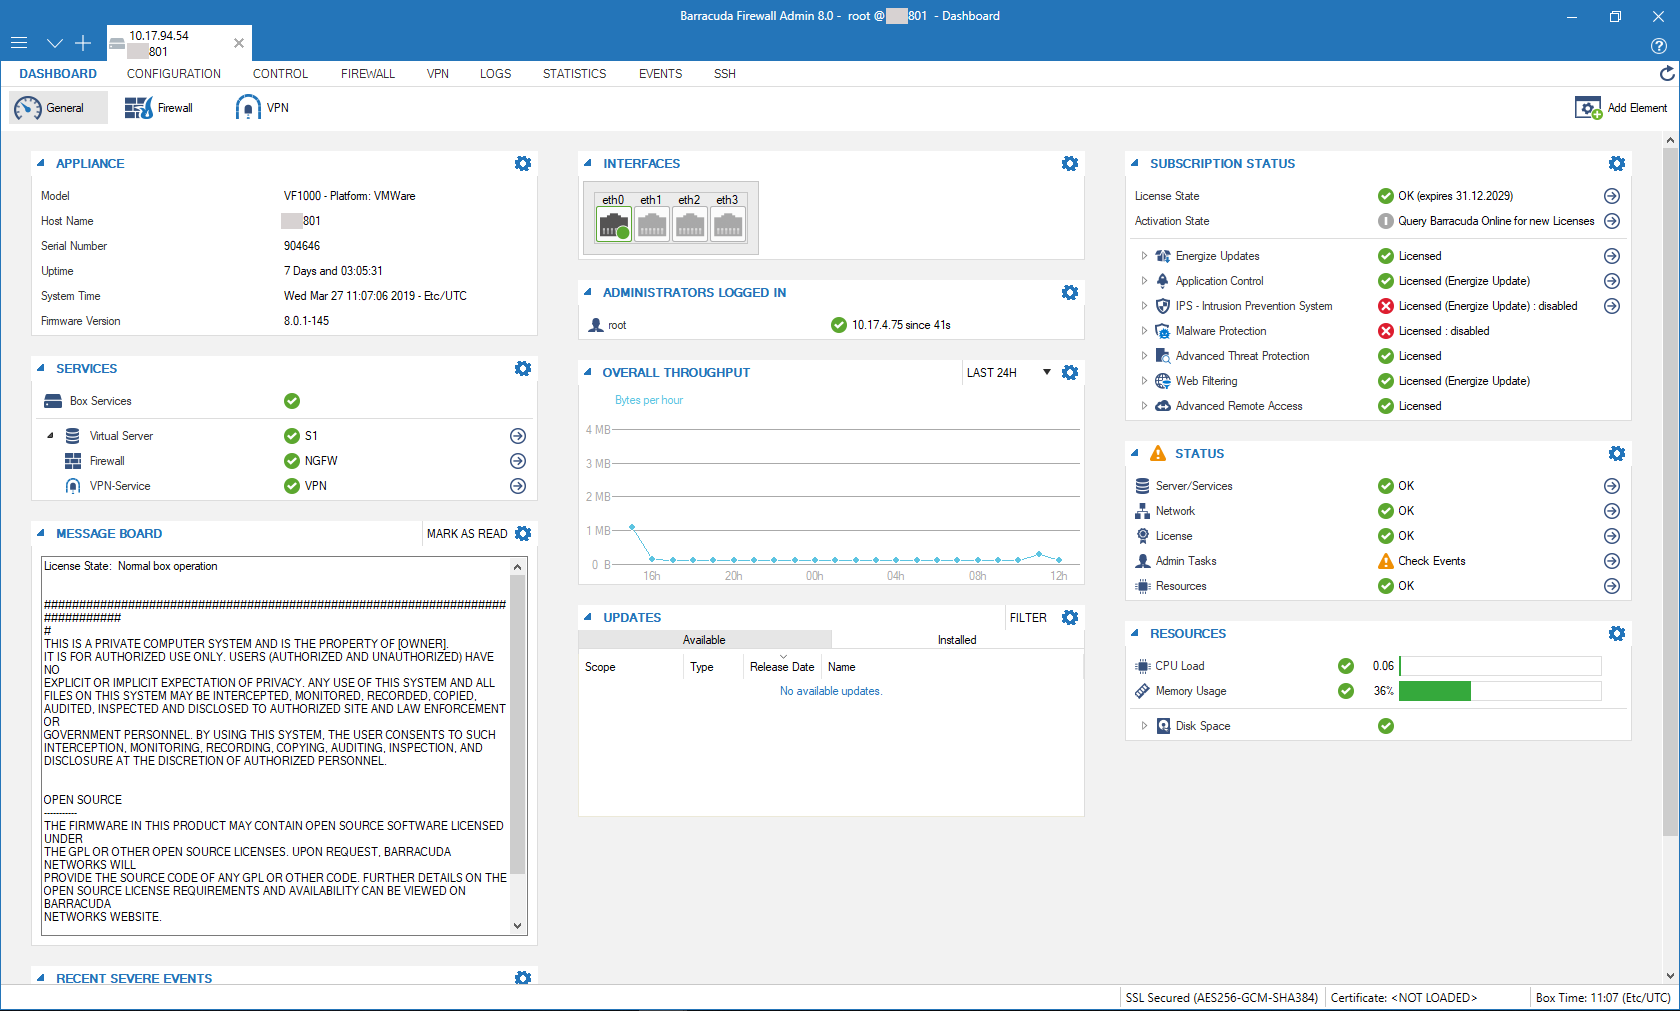
The DASHBOARD page provides you with a summary of the system. It is the page you see when you first log into the Barracuda CloudGen Firewall. To open this page from another section in Barracuda Firewall Admin, click the DASHBOARD tab.

The DASHBOARD page organizes system information into expandable elements. You can move (by using drag-and-drop) and modify each element according to your requirements.
Clicking the cogwheel icon on the top right of an element opens the following context menu:
- Update – Refresh the element view and update the information displayed in the element.
- Set Update Interval – Allows setting a time interval for automatic update of the element.
- Show Communication Errors – Display update errors, if present.
- Remove Element – Remove the element from the page. To add an element to the page, click Add Element on the top right of the page and select the element you want to add.
Information in the DASHBOARD tab is arranged into the sub-pages General and Firewall (and VPN, if configured). To access the information for each page, click the corresponding tab in the ribbon bar on top of the page.
For more information, see:
