When requested by Barracuda Networks Technical Support, a system report can be generated containing information on the firewall system and setup. The system report is saved as a tar archive (*.tgz) on your firewall. The following information is included in the system report generated via Barracuda Firewall Admin:
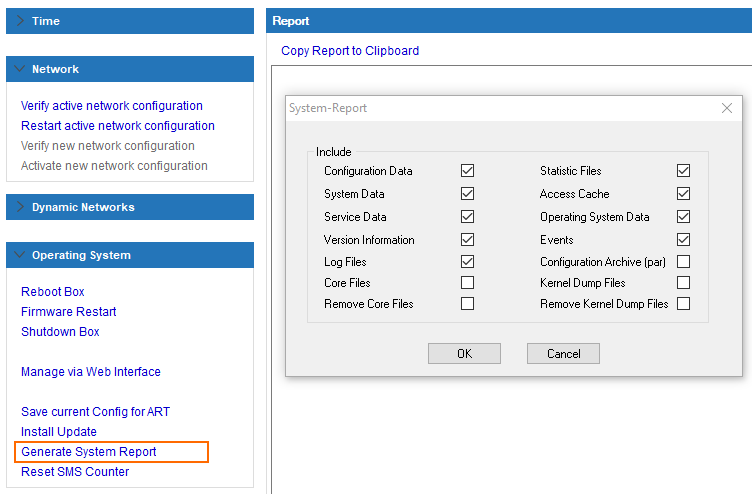
Configuration Data – System configuration information.
System Data – Basic information about the system.
Service Data – Information about introduced services and their configuration.
Version Information – The currently installed version of the system.
Log Files – All log files on the system.
Core Files – Core files generated by the system.
Remove Core Files – Remove core files generated by the system.
Statistics Files – All statistics files on the system.
Access Cache – A snapshot of the access cache‘s current state.
Operating System Data – Information about the OS configuration.
Events – All events on the system.
Configuration Archive (par) – The system PAR file.
Kernel Dump Files – Kernel dump files generated by the system.
Remove Kernel Dump Files – Remove kernel dump files generated by the system.
System reports generated via the command line contain the following information and files:
Name | Content | Comment |
|---|---|---|
| The system report XML file. Contains all but statistics and logs. | default |
| An identity file to distinguish between several system reports. | default |
| A system report may be installed on a CloudGen Firewall as a hotfix. This script acts as the installer for the hotfix. | default |
| The XML style sheet for the system report. | default |
| Image files for the system report. | default |
| The statistics file collection as a bzip2-compressed tar archive. To view the content of the archive type:
| optional |
| The log file collection as a bzip2-compressed tar archive. To view the content of the archive type:
| optional |
| The configuration archive | optional |
Create a System Report
A system report can be created using Barracuda Firewall Admin or via the command line.
Create a System Report Using Barracuda Firewall Admin
Log into the firewall.
Go to CONTROL > Box.
In the left menu, expand Operating System and click Generate System Report.

In the System Report window, select the data that you want to include in the report, and click OK.
In the Save As window, select where you want to save the system report tar archive (*.tgz) file. A Progress window opens after you make your selections.
You can now email the system report file to Barracuda Networks Technical Support.
Create a System Report via Command Line Interface
The name of the executable is system-report and is located in: /opt/phion/bin/
Log into the firewall via SSH or serial console.
Create a system report:
Standard system report:
/opt/phion/bin/system-reportCustom system report:
/opt/phion/bin/system-report --collect <comma separated list of parameters - see list below>
Available command line parameters E.g., /opt/phion/bin/system-report --collect config,services,log,event
Parameter | Description |
|---|---|
|
|
| Service data |
| System data |
| Version information |
| Log data |
| Statistics data |
| Content of the access cache |
| Barracuda CloudGen Firewall information |
| Event data |
| Collects all available data except the par file. To exclude data, add one of the parameters above with a leading |
Both commands generate a system report that contains config, service, log, and event data.
PAR File Integration
By default, a system report does not contain a PAR file; however, it is possible to integrate a PAR file into a system report.
To include a PAR file into a system report, type:
/opt/phion/bin/system-report --par
A system report is a gzip-packed tar archive (*.tgz) and can be viewed within the command-line interface.
To view the content of a system report type:
tar -tvzf system-report.tgz
Viewing System Reports
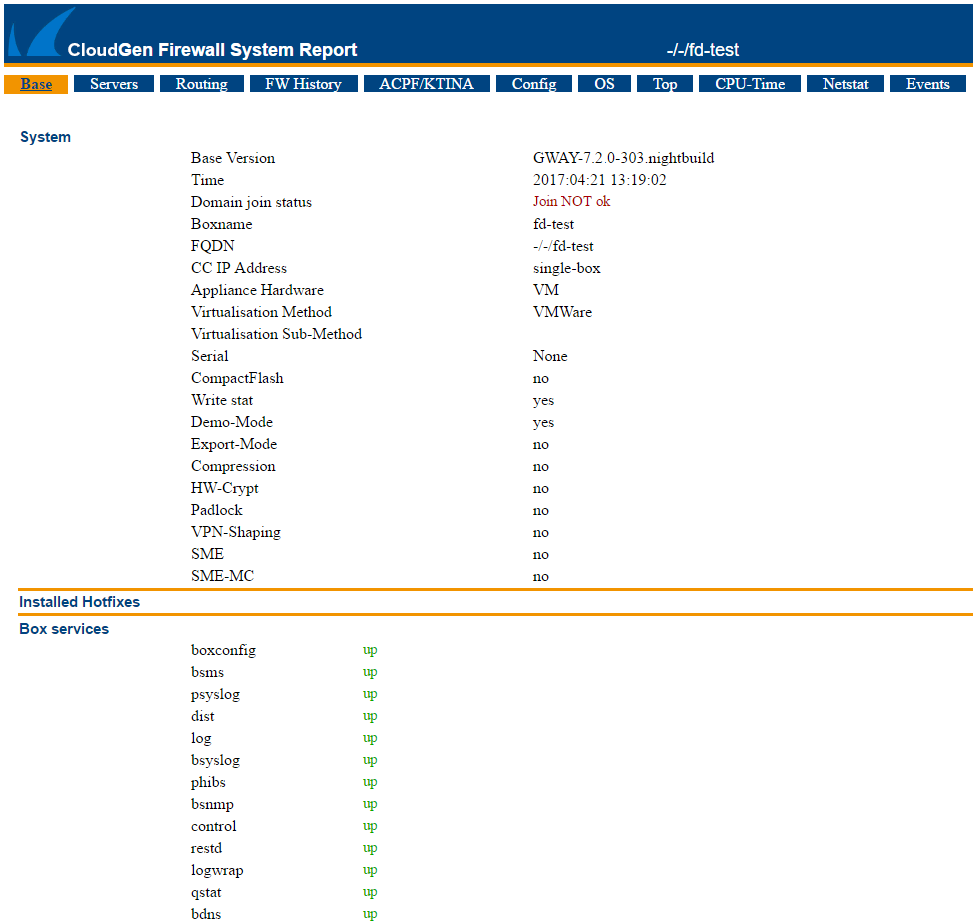
Statistics and log files are only viewable with the aid of the statistics or log viewer of Barracuda Firewall Admin. Therefore, system reports can be installed on a firewall. System reports are designed as hotfixes and can simply be installed like any other hotfix. When installing a system report, the files system-report.xml, sysreport.xsl, and the required images will be loaded into the firewall’s internal web server in order to be viewable by a web browser.
Step 1. Configure the Internal Web Server
Before installing system reports, verify that Enable System Reports is selected in the forwarding firewall settings. This step is required to view the content of the report.
Go to CONFIGURATION > Configuration Tree > Box > Assigned Services > Firewall > Forwarding Settings.
In the left menu, select Authentication.
Click Lock.
In the Authentication Server Configuration section, click Show/Edit next to Operational Settings. The Operational Settings window opens.
In the CGI Interface section, set Enable System Reports to Yes.
Click Send Changes and Activate.
After changing these settings, a firmware restart (CONTROL > Box) is required.
Step 2. Configure the Firewall
To be able to view statistics and log data with a web browser, an access rule must be introduced. This is necessary because, due to security reasons, the integrated web server only listens for connections on the loopback interface.
Viewing System Reports via Web Browser
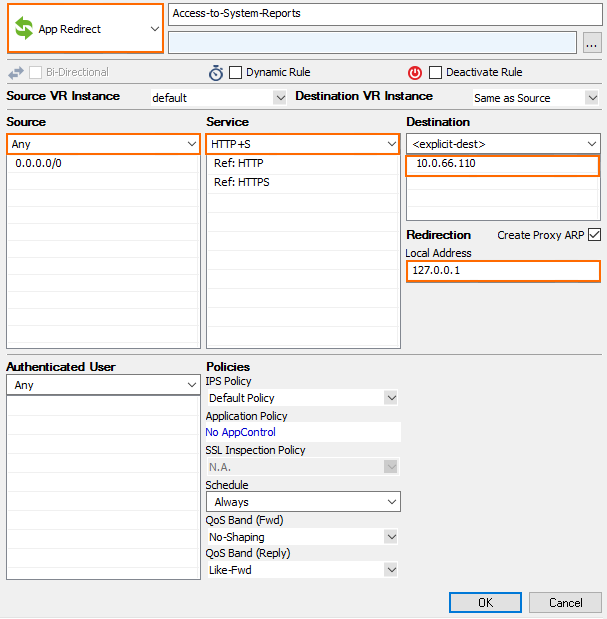
Create a rule with the following settings:
Action – Local Redirect
Source – Define the desired source network
Service – HTTP+S
Destination – The box IP address of the firewall
Redirection – The loopback address 127.0.0.1

Step 3. Install the System Report
Log into the firewall.
Go to CONTROL > Box.
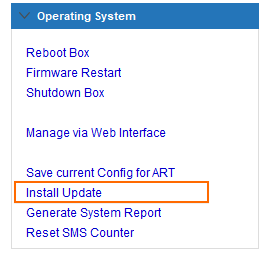
Click Install Update, and specify the source of the desired system report.

Install the system report.
To view previously created system reports, open a web browser to the following URL: http://<ip>/cgi-bin/show-sysreports
Note that <ip> stands for the IP address or a DNS-resolvable name of the configured firewall.

Viewing Statistics
Statistics data of installed system reports can be viewed within the statistics viewer of Barracuda Firewall Admin. For more information, see STATISTICS Tab.
Viewing Log Files
Viewing log files is only possible if a special registry key was set at the client workstation the Barracuda Firewall Admin client is running on.
Start the Windows Registry Editor by typing
regeditin the MS Windows command line.Navigate to
HKEY_CURRENT_USER\Software\Barracuda\ngadmin\logRight-click and choose New followed by DWORD Value.
Set the name of the registry key to
showrangeand its value to 1.
Log data of installed system reports can be viewed within the log viewer of Barracuda Firewall Admin. For more information, see LOGS Tab.
Uninstalling System Reports
System reports can be removed via the web interface or directly on the CLI.
Inside the web interface, each system report has a Remove button.
Within the command line interface, type:
/var/phion/fwauthd/cgi-bin/remove-sysreport -r <id>where<id>stands for the system report id.
When removing a system report, all of its data will be removed from the system and no additional warning message is displayed.
