Azure Monitor Agent is the official replacement for the OMS Agent that will be deprecated on August 31, 2024. The agent is used to stream logs to a Microsoft Log Analytics workspace. Azure Monitor Agent is supported on stand-alone and CC-managed CloudGen Firewalls. With Azure Monitor Agent, the machines streaming logs to a Log Analytics Workspace are no longer directly connected to it, but are associated to a Data Collection Rule, instead. For Azure virtual machines, the agent is automatically installed when the VM is associated to a Data Collection Rule for the first time. On-premises machines first need to be imported into Azure as Connected Machines before they can be associated to a Data Collection Rule.
Detailed list of the logs streamed to Azure Log Analytics
Log Files
All log files are streamed in Common Event Format (CEF). For Barracuda CloudGen Firewall versions starting with 9.0.2, the following log files are streamed:
Firewall activity log (box_Firewall_Activity.log, event id 100)
Firewall threat log (box_Firewall_threat.log, event id 200)
VPN user accounting log (box_Firewall_user_accounting.log, event id 300)
SD-WAN data log from the VPN server (srv_CSC_VPN_sdwandata.log, event id 400)
The logs are automatically configured for streaming as soon as a box is associated to a Data Collection Rule.
Note that in the following two cases there is no automatic log streaming configuration done when associating to a Data Collection Rule:
CC-managed boxes do not stream any log files by default. You can manually create the configuration, but please note the list of supported log files when doing so.
When a secondary box in an HA setup is associated to a Data Collection Rule, log streaming configuration will not take place automatically. This must be done by associating the primary partner.
Known Issues
When a machine that was previously associated to a Data Collection Rule is disassociated, the Azure Monitor Agent extension remains installed on the box and must be manually uninstalled. This is the default behavior of Azure. All the associated processes of Azure Monitor Agent are stopped so they do not consume additional resources while the extension is inactive.
If an on-premises box is disconnected from Azure without first removing the Azure Monitor Agent extension, and is then re-connected to Azure and re-associated with a Data Collection Rule, manual intervention is required to activate the new configuration. This can be done on the CLI with the following command: amactl setup
Before You Begin
Create a Log Analytics Workspace
For instructions, see Step 1 and 2 in How to Configure Log Streaming to Microsoft Azure Log Analytics.
Import Your On-Premises CloudGen Firewalls into Azure via Azure Connected Machine Agent
In order to import an on-premises box into Azure, a service principal is required. The service principal must have the following roles:
Azure Connected Machine Onboarding for the resource group where the on-premises box will be imported into
Azure Connected Machine Resource Administrator to be able to read, modify or delete an on-premises box imported into Azure
The steps required for creating the service principal are documented in: Create a service principal for onboarding at scale
Once the service principal is created, complete steps 1-6 from the following documentation in order to get the required parameters for the connection: Generate the installation script from the Azure portal. 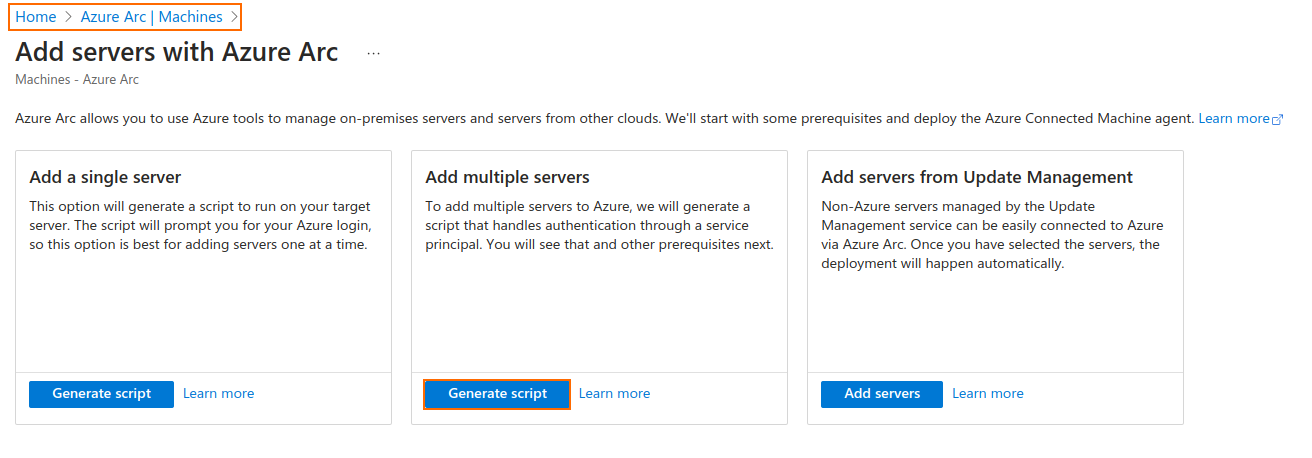
At Step 7, the script does not need to be downloaded; however, the connection parameters should be noted down.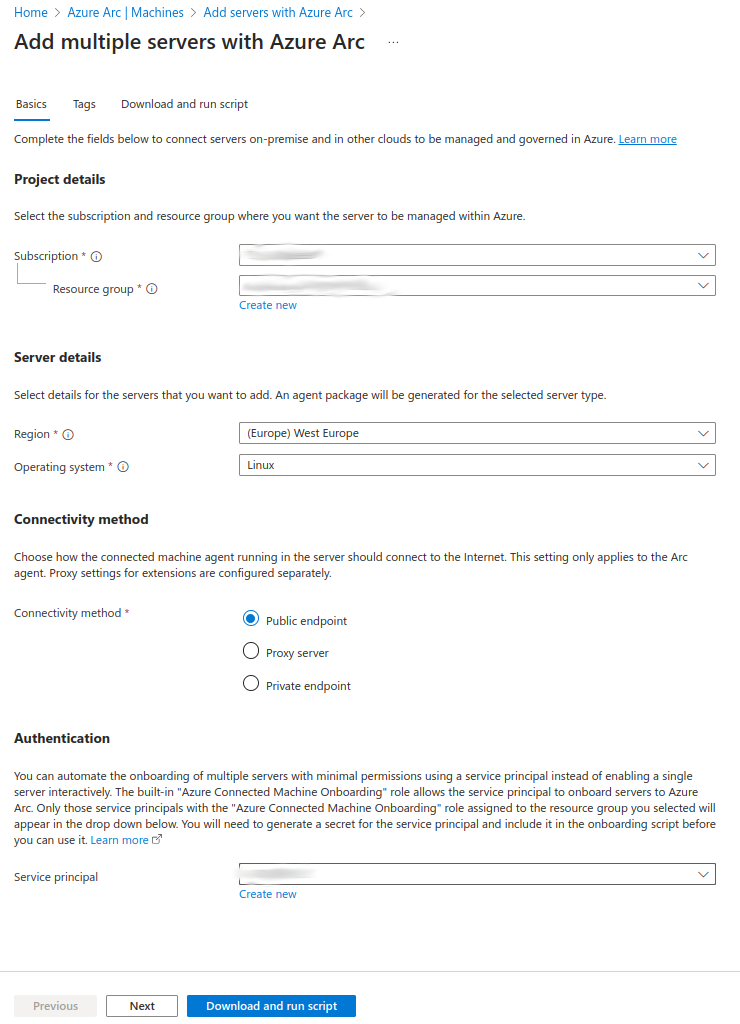
The following parameters are required:
Service Principal ID (client ID)
Service Principal password (client secret)
Service Principal Tenant ID
Subscription ID
Region
Resource Group
Correlation ID
With these parameters, configure the Azure Connected Resource using Firewall Admin o n each CloudGen Firewall that should stream log files to Microsoft Log Analytics:
- Go to CONFIGURATION > Configuration Tree > Cloud Integration.
- In the left menu, expand the Configuration Mode section, and click Switch to Advanced View.
- Click Lock.
- In the left menu, select Azure Connected Resource.
- Select Yes to Connect box to Azure.
- Fill in the parameters for the connected resource.
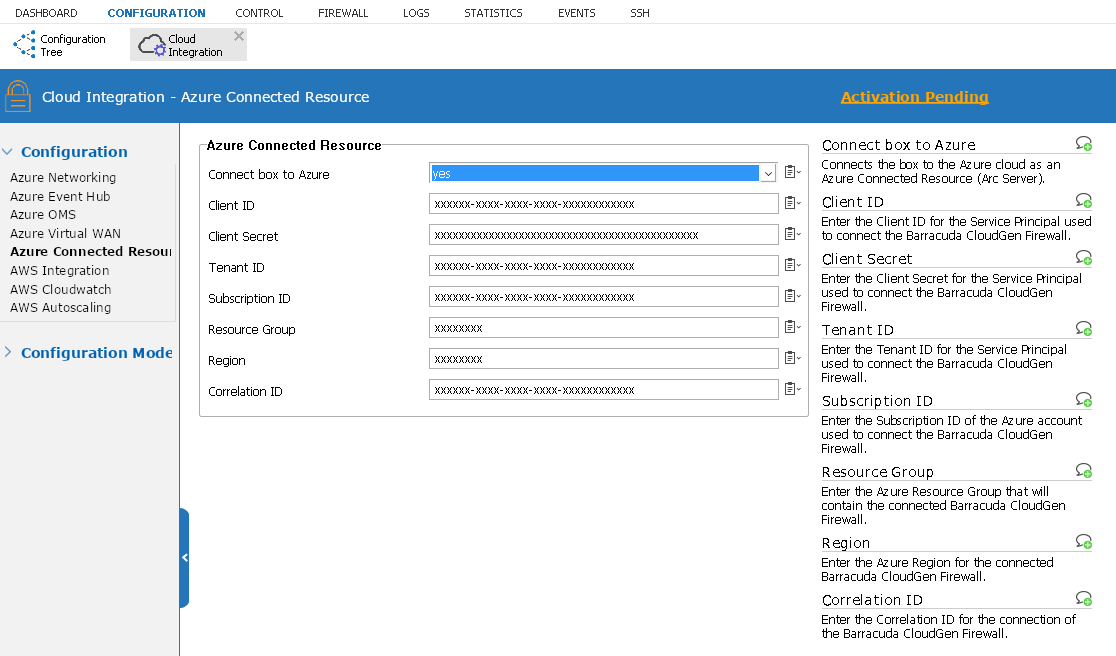
- Click Send Changes and Activate.
After the configuration is activated, it takes a few minutes until the box is imported and available in Azure.
Step 1. Create a Data Collection Rule
To associate your CloudGen Firewall resources with Microsoft Log Analytics, integrate Azure Sentinel and create a Data Collection Rule. The following steps concern all CloudGen Firewall units that were imported or deployed directly in Microsoft Azure.
Add Microsoft Sentinel to the Log Analytics Workspace
To stream the logs in the Common Event Format, you must add Azure Sentinel to the corresponding Log Analytics Workspace.
- Log into the Azure portal: https://portal.azure.com
- Go to All services and search for Microsoft Sentinel.
- Click + Create.
- Select your workspace and click Add.

- Click Add.
Install the CEF Data Connector
After adding Microsoft Sentinel to the Log Analytics Workspace, use the Data Connectors tab to install the Common Event Format Data Connector.
- Go to your workspace.
- In the left menu, select Data connectors.
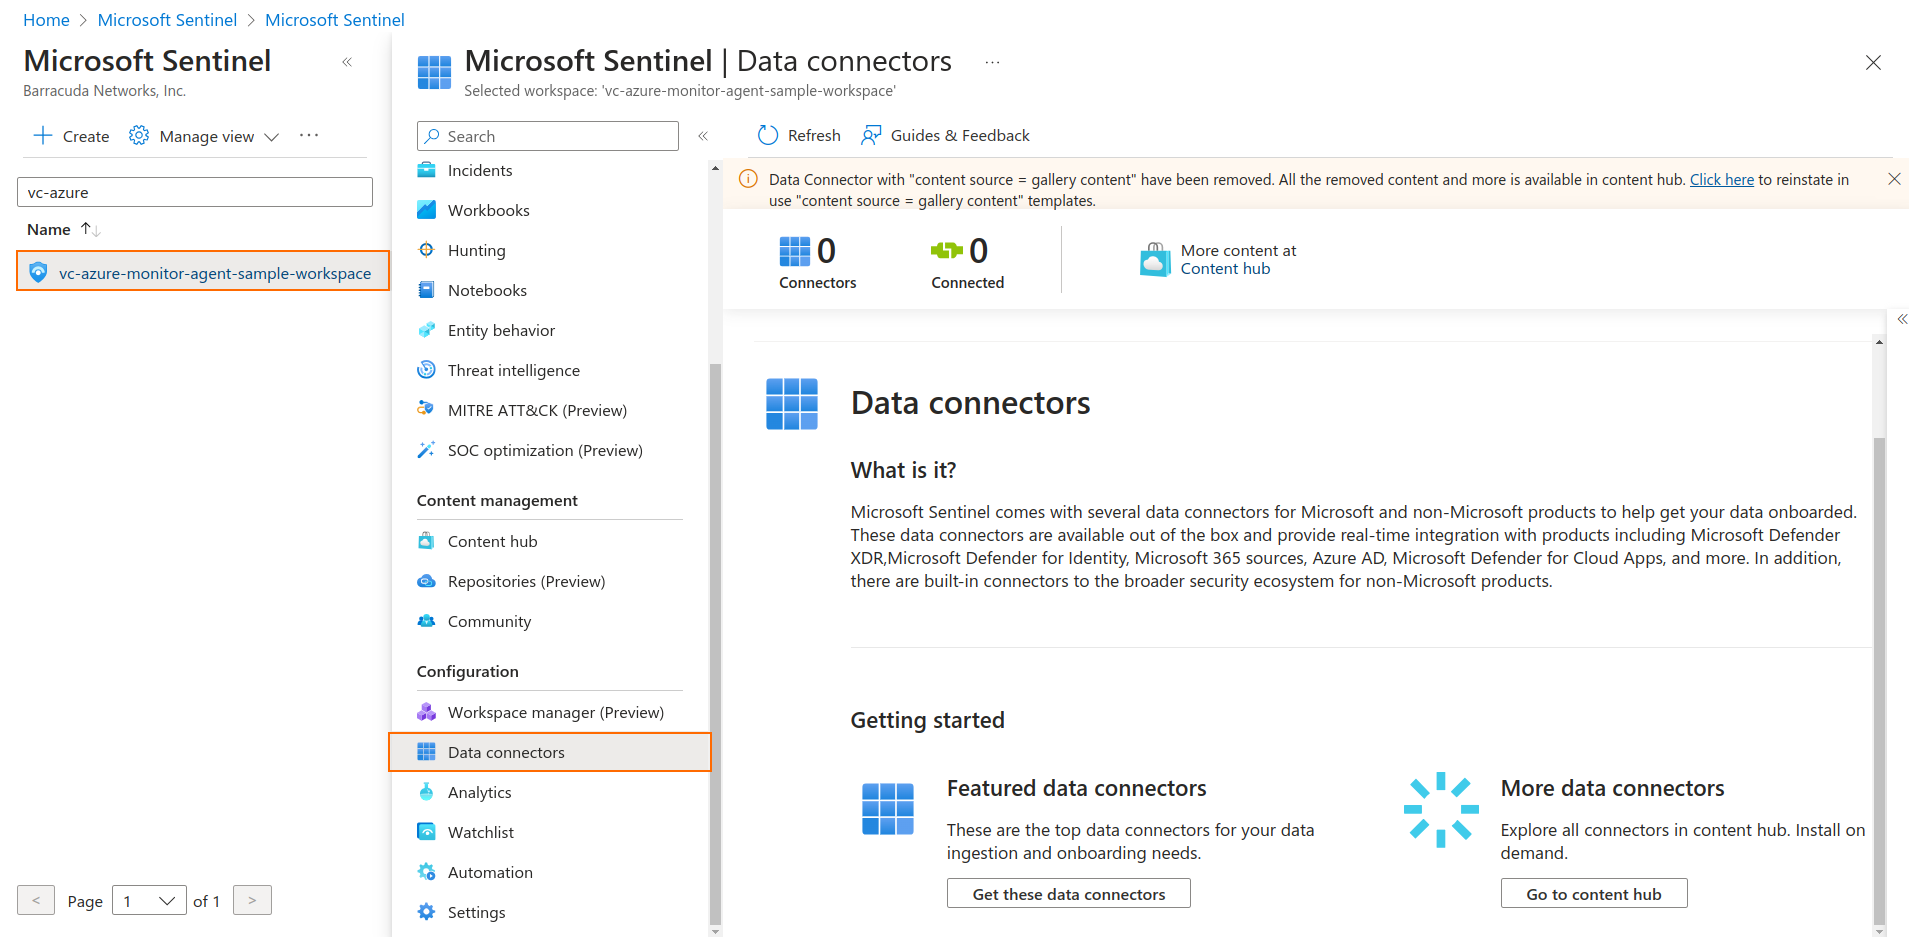
Under More data connectors, click Go to content hub.
Search for
CEFand install the data connector.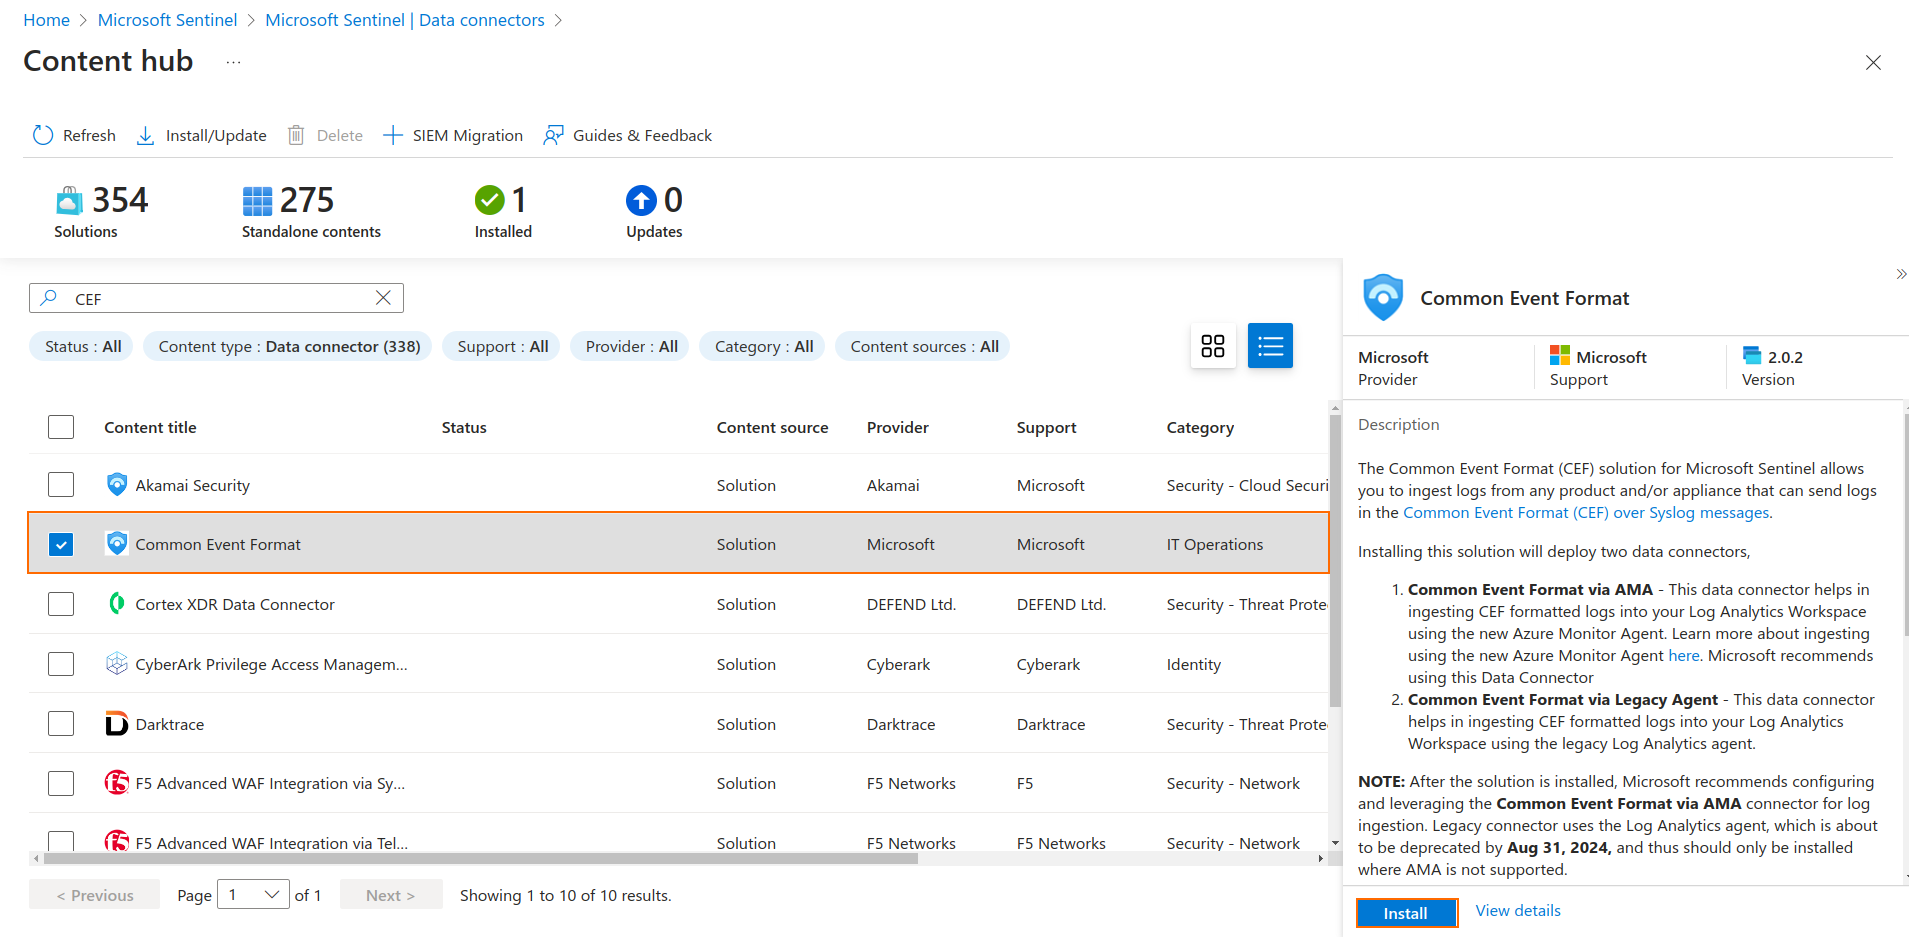
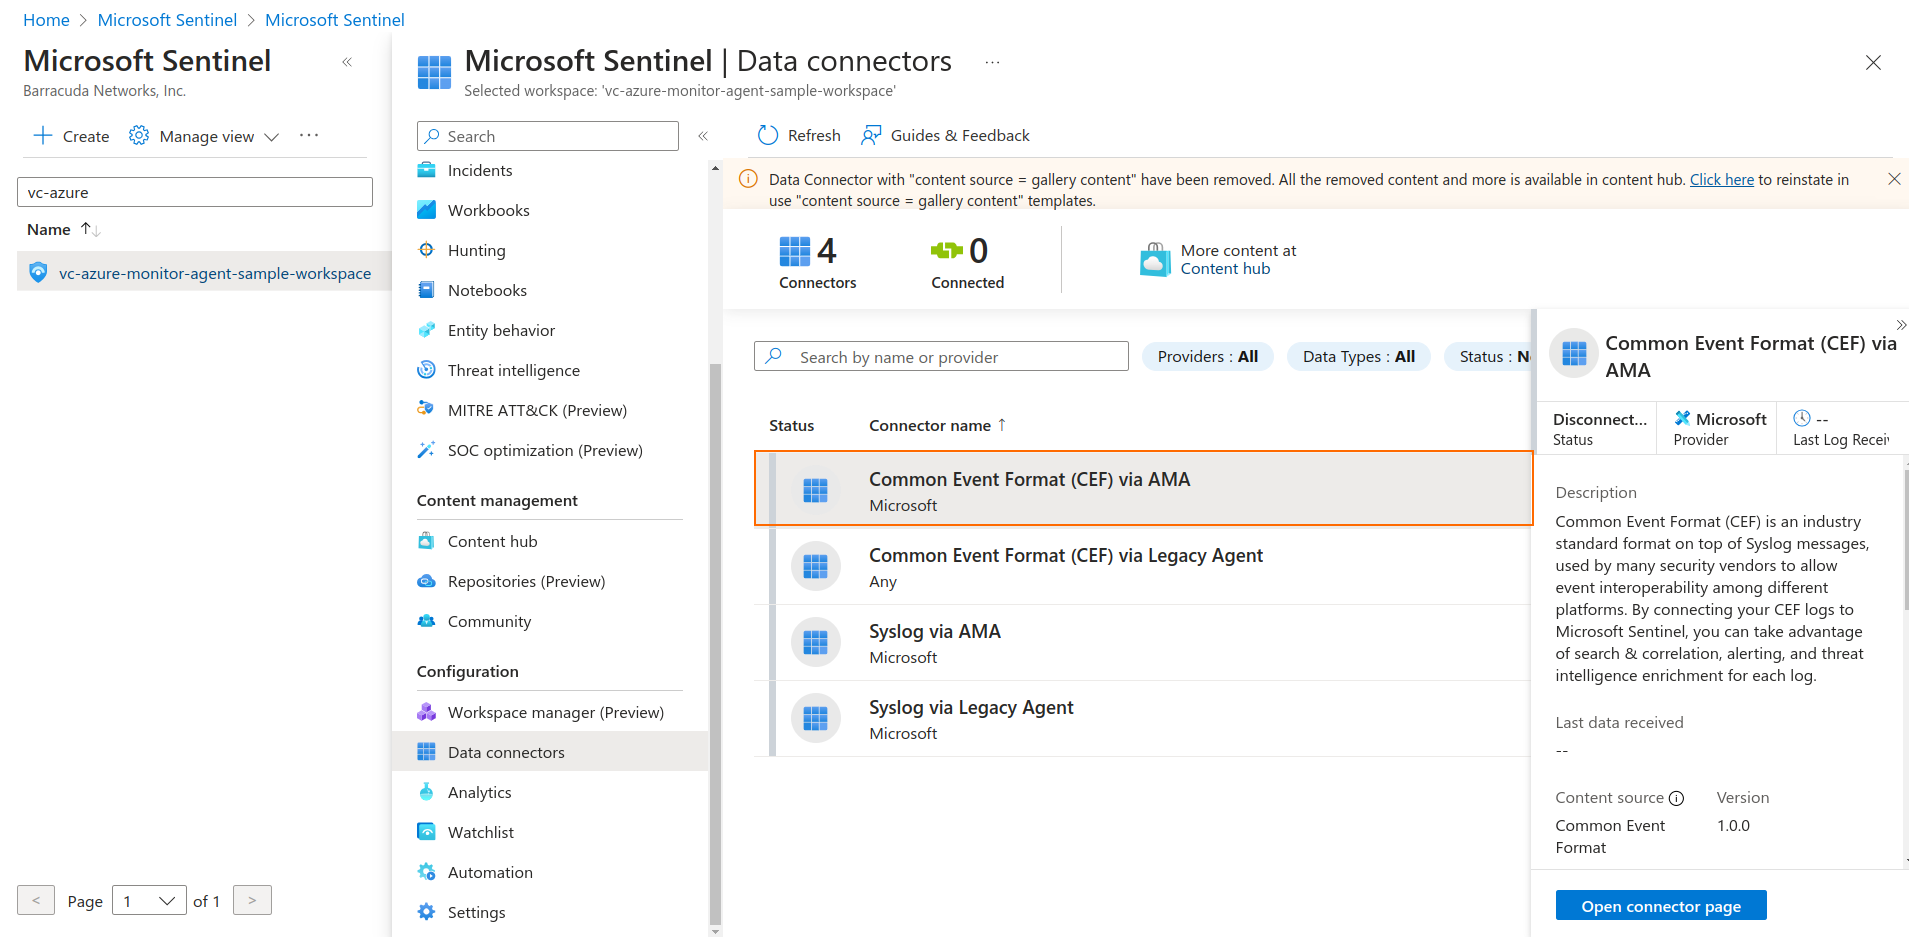
- After the connector has been successfully installed, click Manage.
Select the Common Event Format (CEF) via AMA connector to open the connector page.
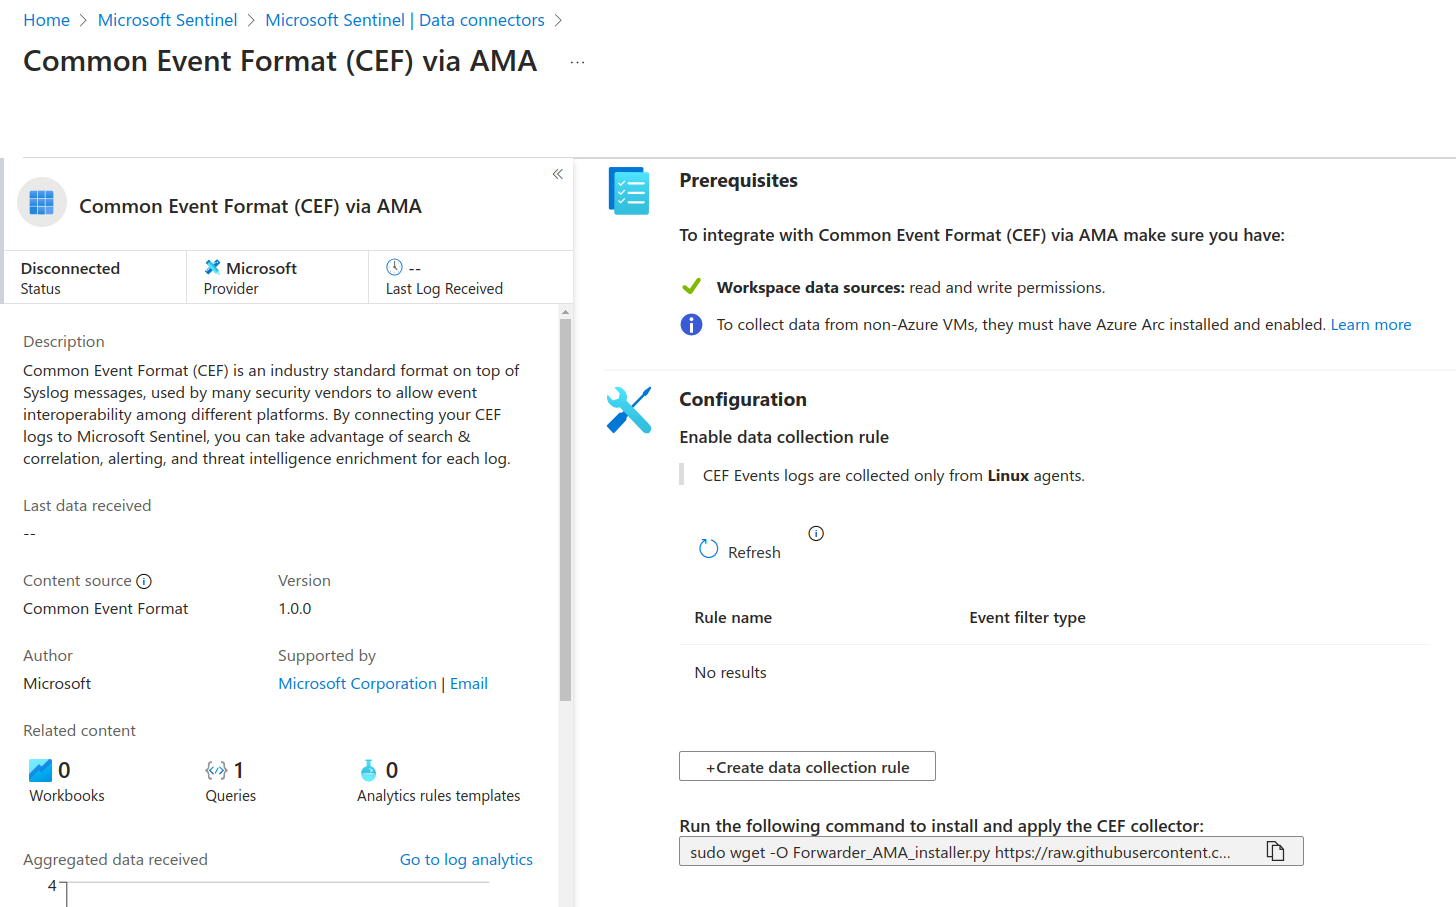
Create a Data Collection Rule
- Click + Create data collection rule.
- Select a Rule name and a Resource group for the Data Collection Rule.
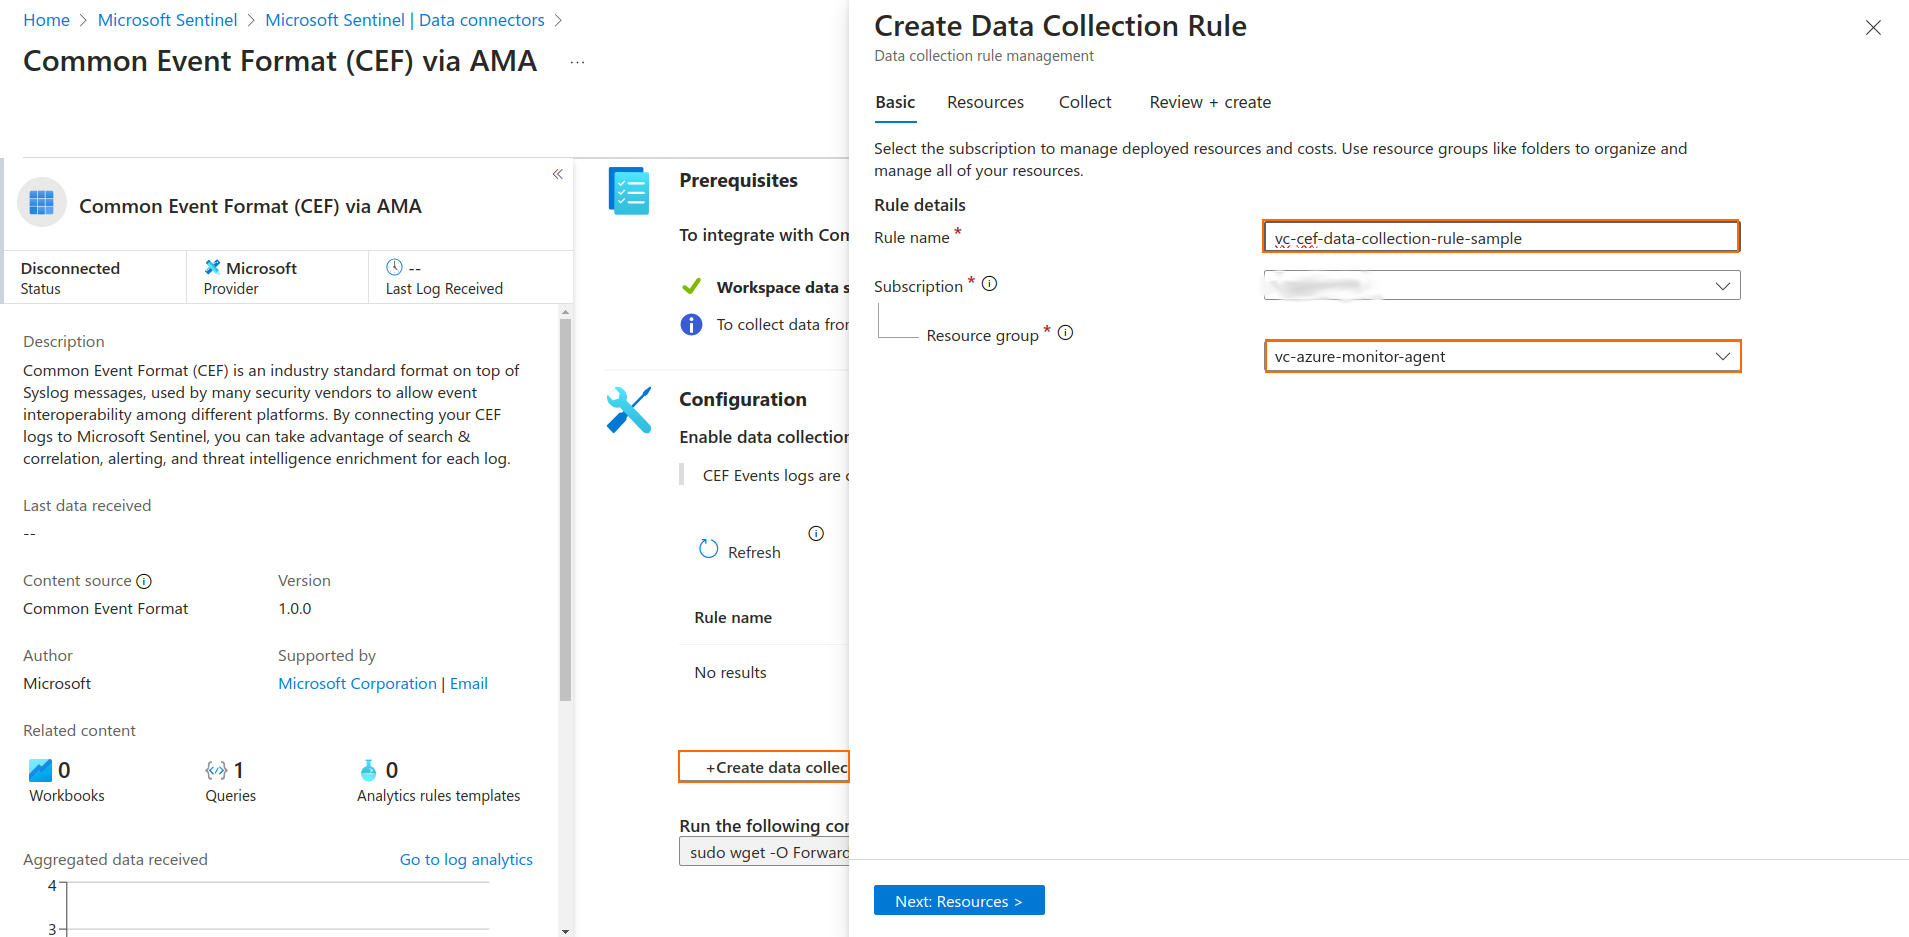
Click Next: Resources.
- Click Next.
- Select a minimum log level for the LOG_USER facility. Log levels for the other facilities are optional.
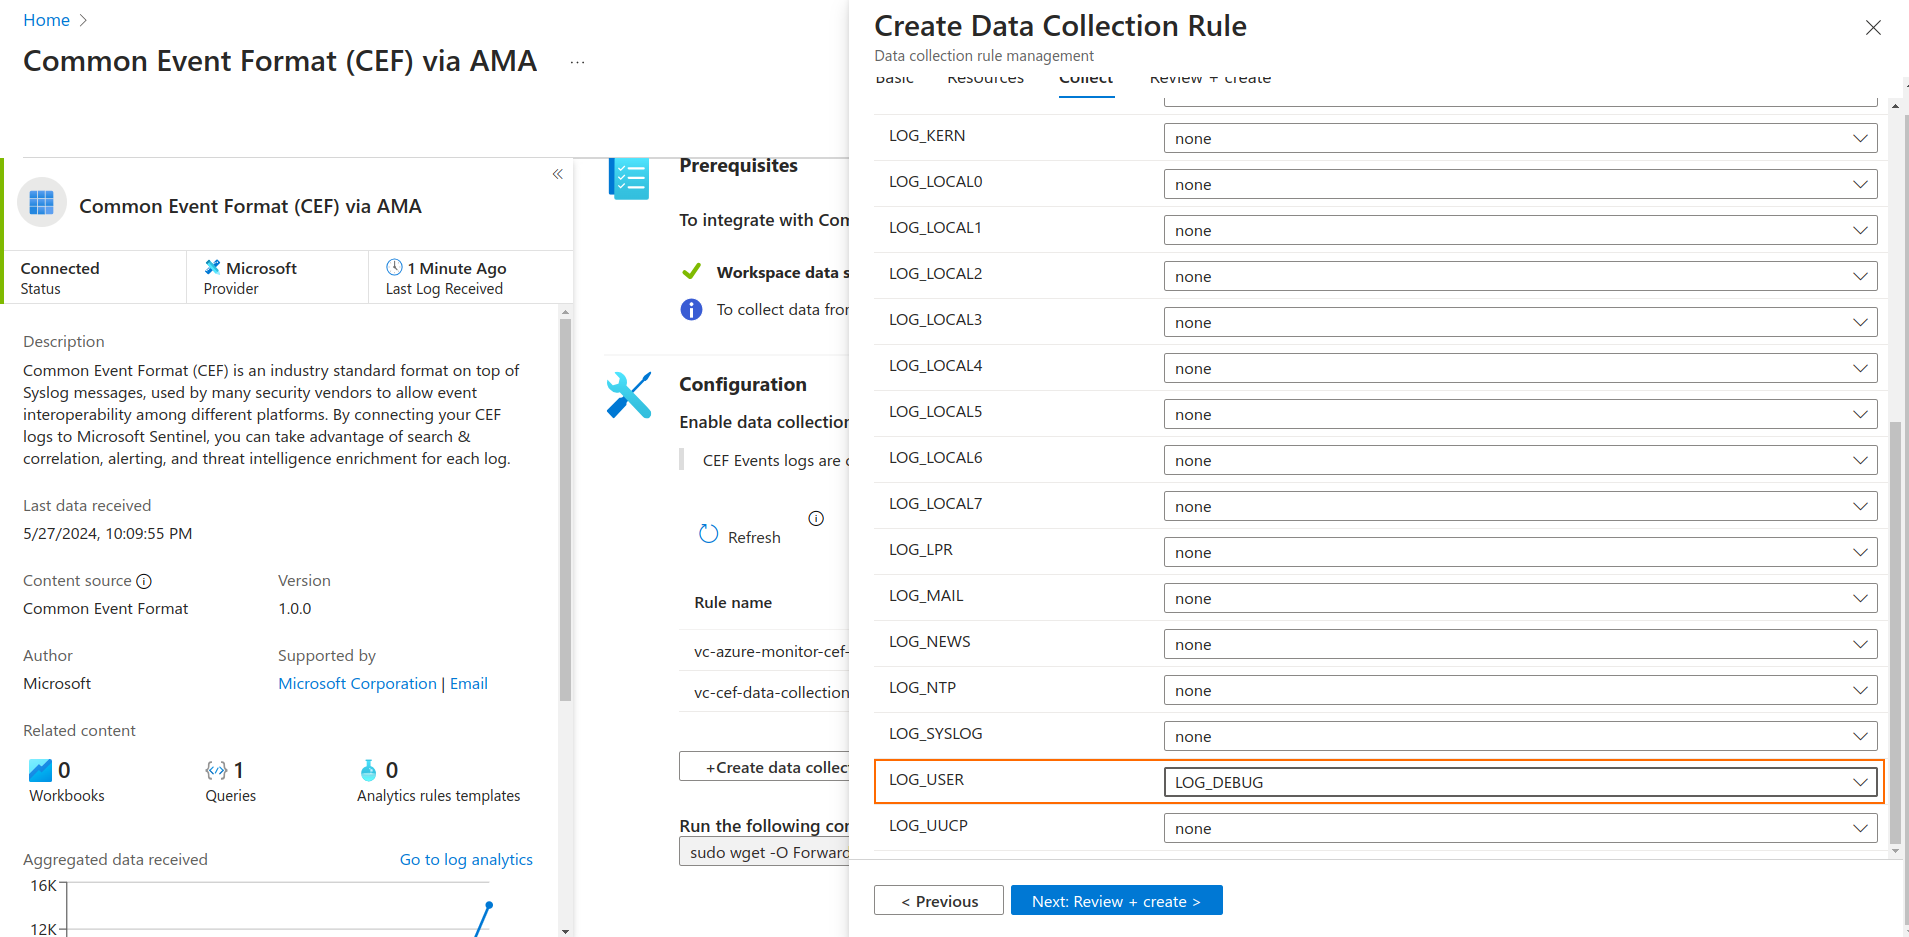
- Review and Create the Data Collection Rule.
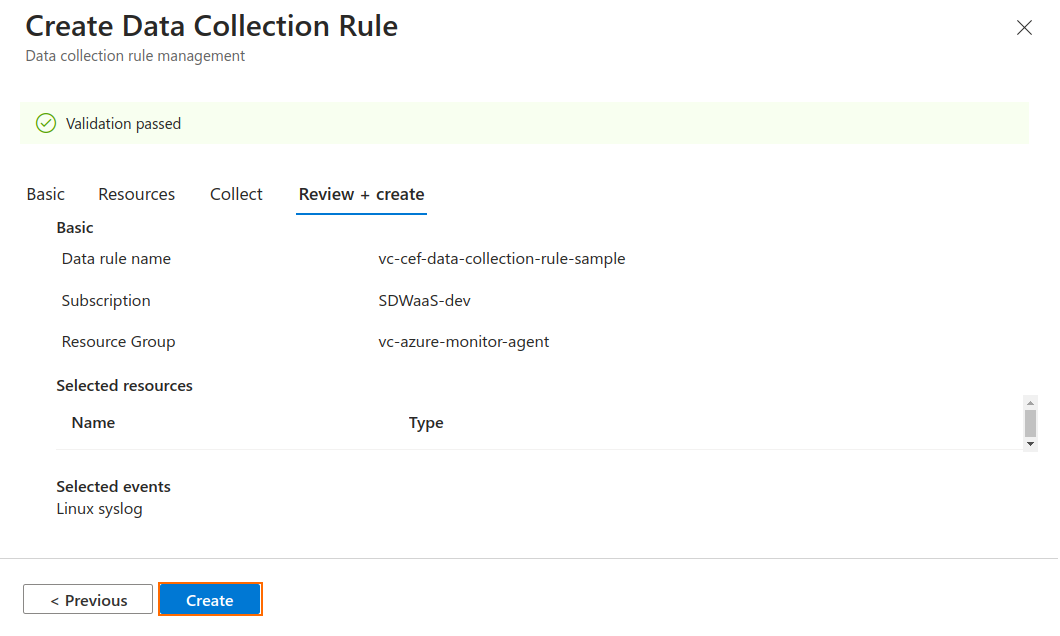
Step 2. Associate Resources to the Data Collection Rule
- Use the Resources tab in the Data Collection Rule to associate machines to it.
You can select multiple resources at the same time, depending on the scope.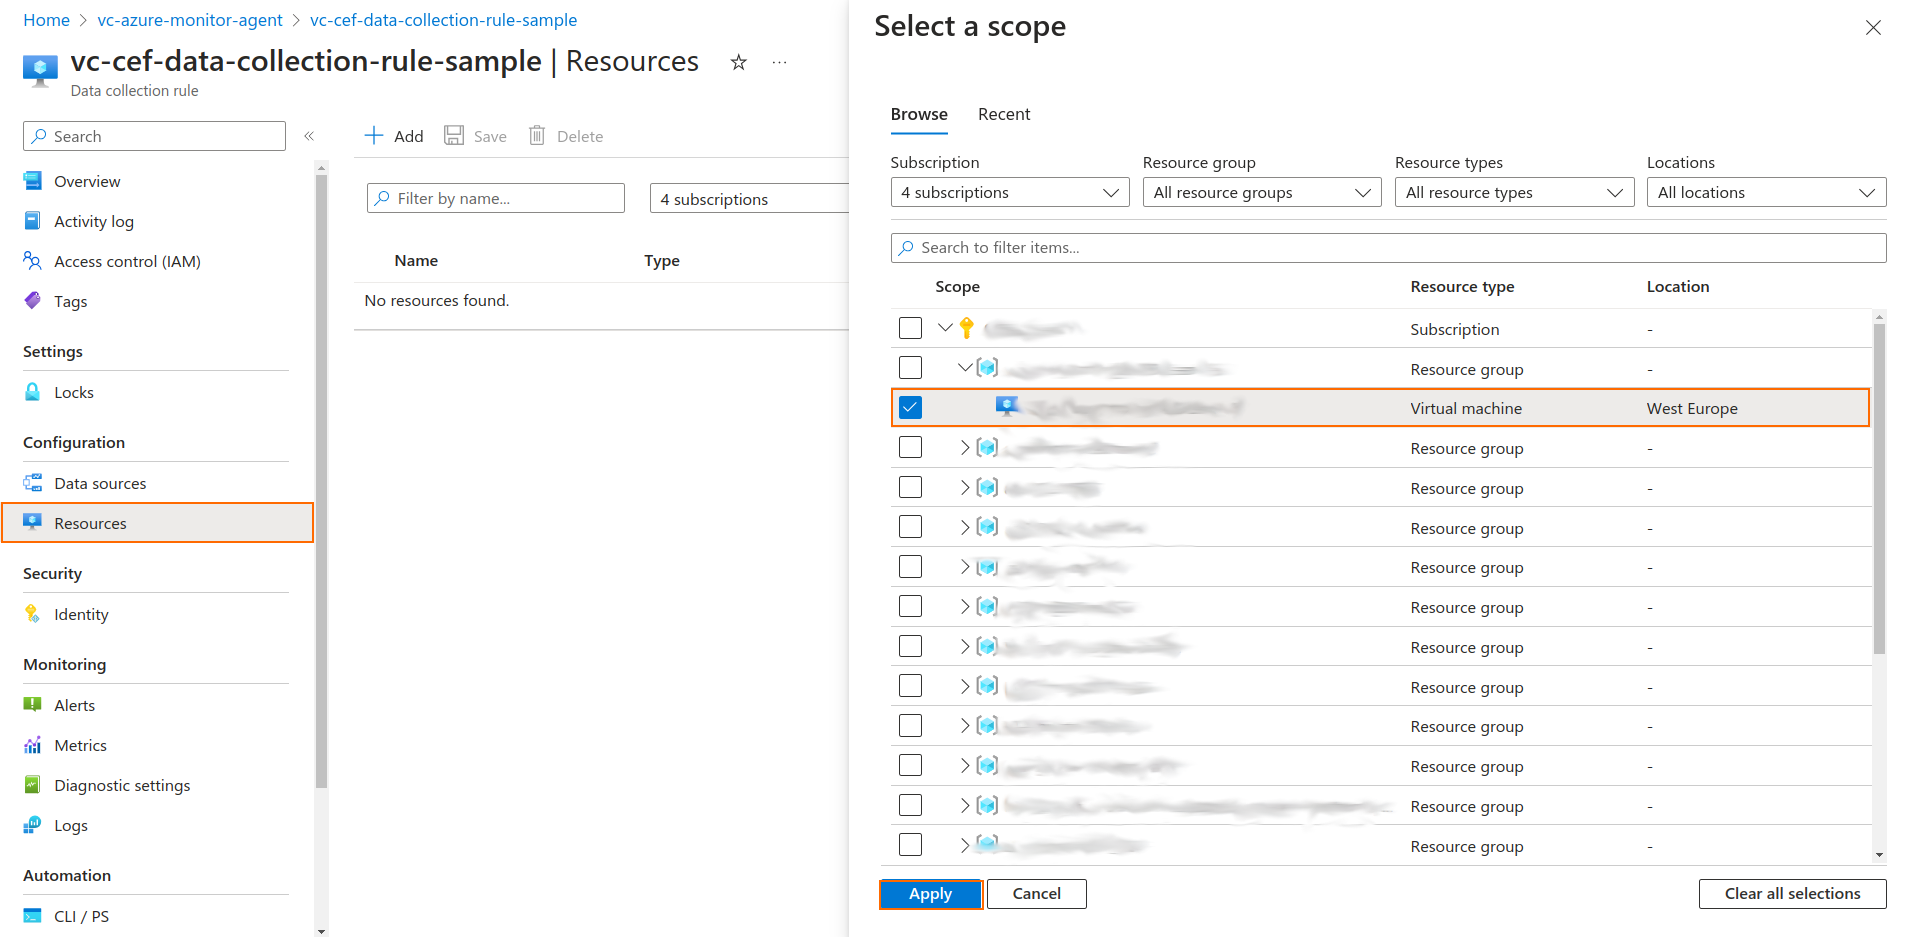
- To associate the resource(s), click Apply.
After the association to the Data Collection Rule is done for the first time, the Azure Monitor Agent extension is pushed to the affected box(es). After its successful installation (which can take up to 10 minutes), the logs should start being streamed to the Log Analytics Workspace defined by the Data Collection Rule.
Checking the State of the Azure Monitor Agent
To check the status of the Azure Monitor Agent extension, open the Extensions tab or go to Extensions + applications for the virtual machine.

The extension Status column gives feedback on the extension installation status.
