

As of SecureEdge version 9.0.4, streaming of SecureEdge Common Event Format (CEF) logs to the Azure Log Analytics Common Security Log table is done via the Barracuda Log Analytics Daemon. The Barracuda Log Analytics Daemon covers the same functionality as the deprecated OMS Agent and the Azure Monitor Agent, and works across all SecureEdge devices. The Barracuda Log Analytics Daemon uses the Azure Log Ingestion API and therefore requires a Data Collection Rule to be set up in the same region as the target Log Analytics Workspace. Barracuda provides an ARM template that can be used to create the necessary Data Collection Rule.
CEF Log files
The following log files can be streamed in the CEF:
The firewall activity log (box_Firewall_Activity.log, event id 100)
The firewall threat log (box_Firewall_threat.log, event id 200)
The VPN user accounting log (box_Firewall_user_accounting.log, event id 300)
The SDWAN data log from the VPN server (srv_CSC_VPN_sdwandata.log, event id 400)
Before You Begin
Create a Microsoft Azure account.
Create a Log Analytics Workspace. For more Information, see How to Configure Log Streaming to Microsoft Azure Log Analytics Workspace.
Step 1 Create the Data Collection Rule
To stream the SecureEdge logs in CEF, you must add Azure Sentinel to the corresponding Log Analytics Workspace.
Log into the Azure portal: https://portal.azure.com
In the left menu, click All services and search for Microsoft Sentinel.
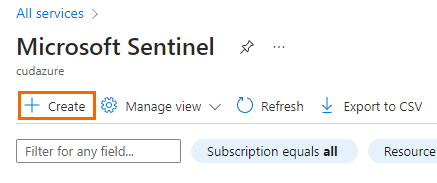
Click Create.
Select the newly created Log Analytics Workspace.
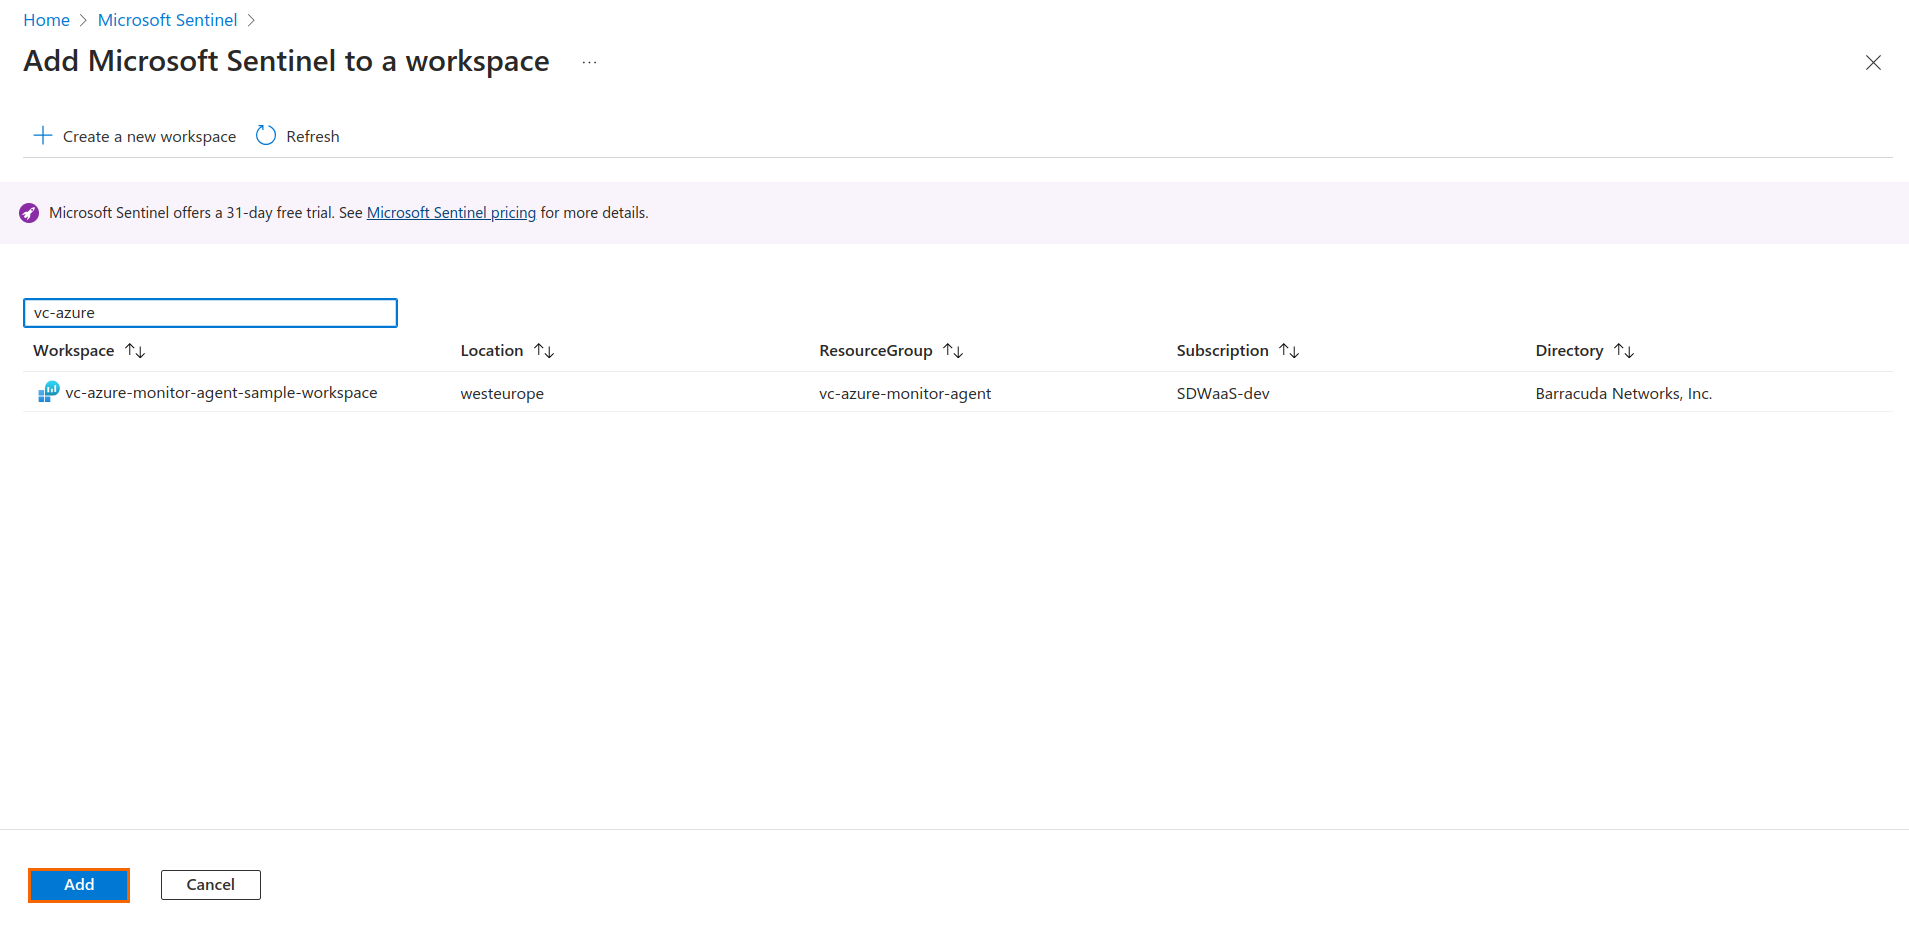
Click Add.
Download the template for the Common Security Log table: bn-azure-log-analytics-dcr-cef.json
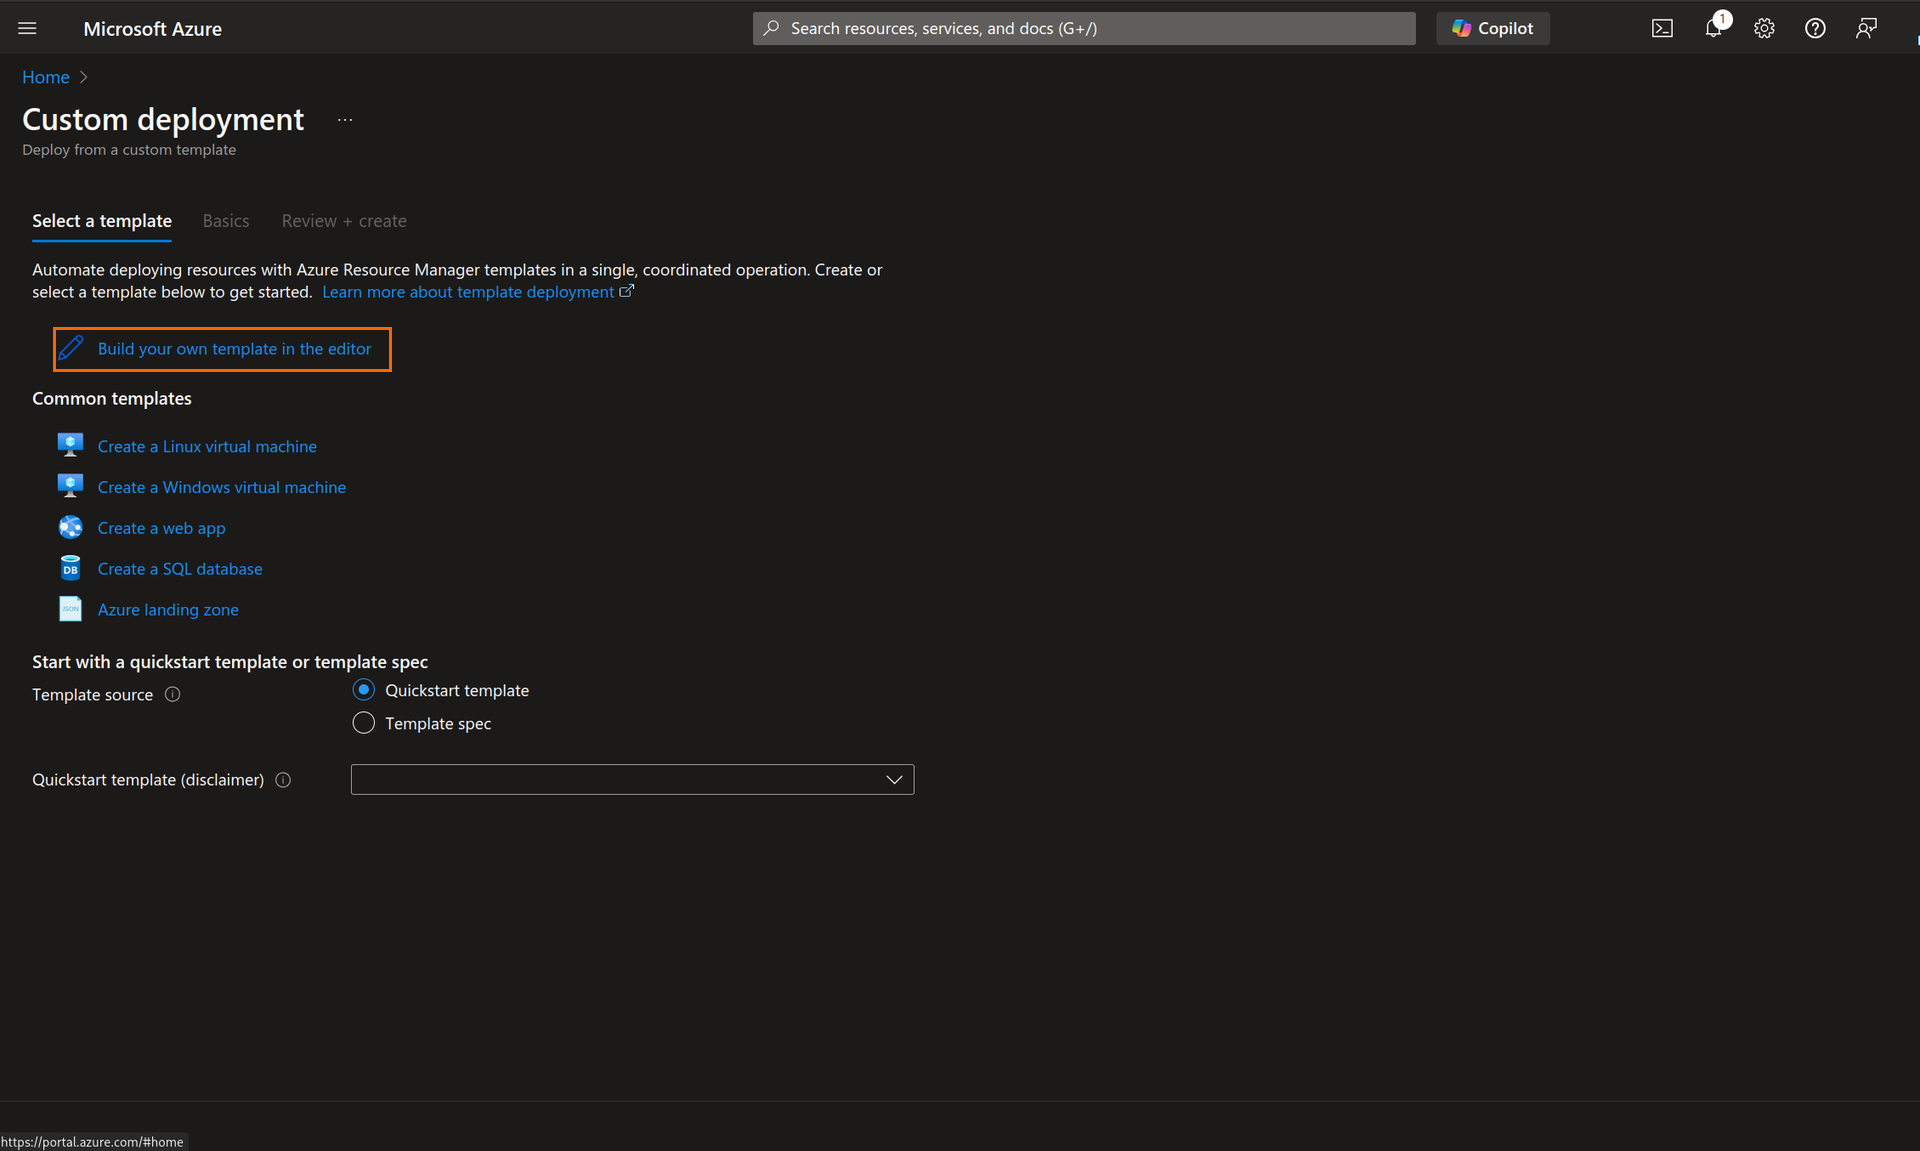
Open the Azure web portal and search for Deploy a custom template and open the corresponding page.
The Custom deployment page opens. Click Build your own template in the editor.
The Edit Template page opens. Replace the sample template in the editor with the contents of the template you wish to deploy.
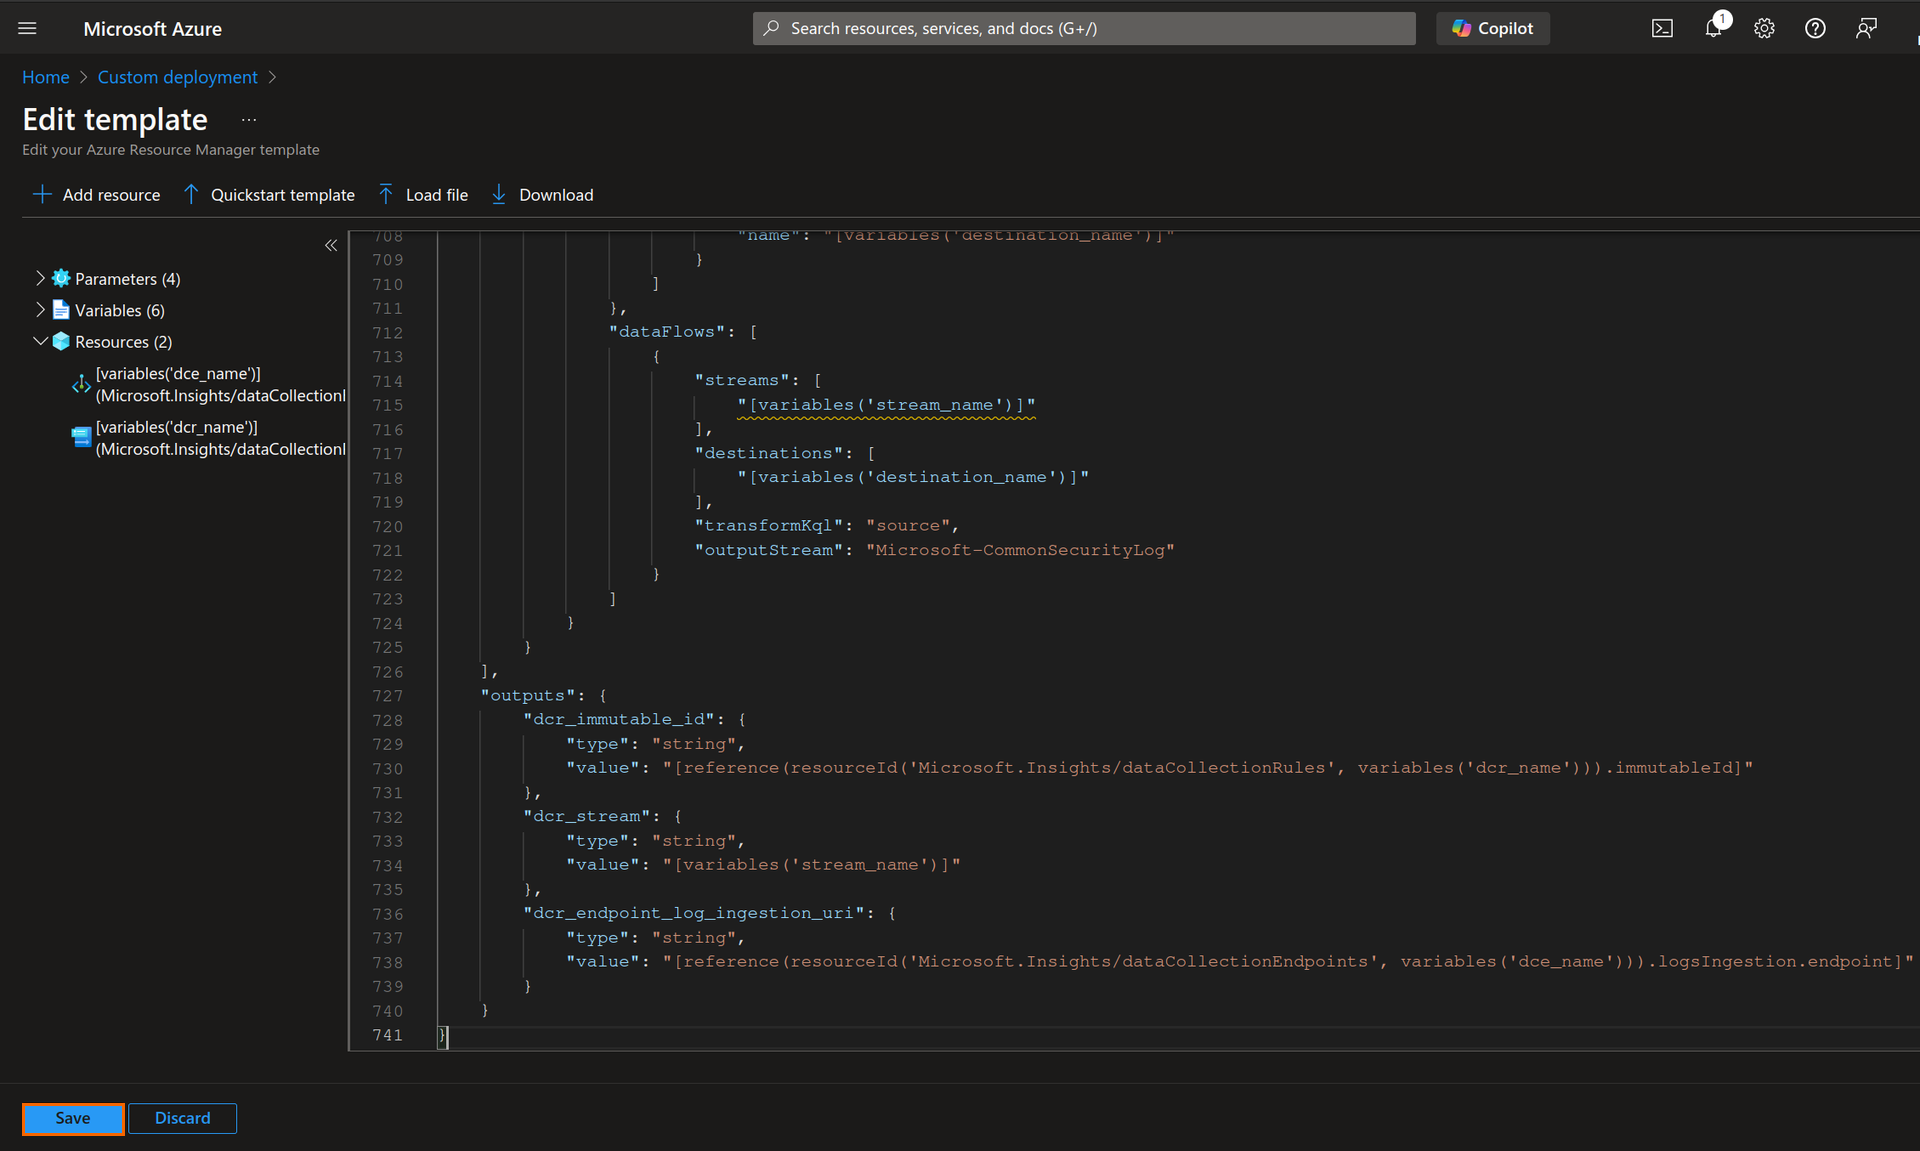
Click Save.
Under the Basics tab, specify the values for the following:
Subscription – Enter your subscription.
Resource group – Enter your resource group for the deployment.
Region – Select region in case of a newly created resource group.
Workspace_name – Enter Log Analytics Workspace name.
Workspace_id – Enter Log Analytics Workspace ID.
Note: If you choose to deploy into a different resource group than the one containing the Log Analytics Workspace, you will need to also specify the Log Analytics Workspace resource group name in the field name Workspace_resource_group. In addition, if you deploy into a resource group different from the one containing the Log Analytics Workspace, and if this resource group is also in a different region, you will need to also specify the Log Analytics Workspace region in the field name Workspace_region.
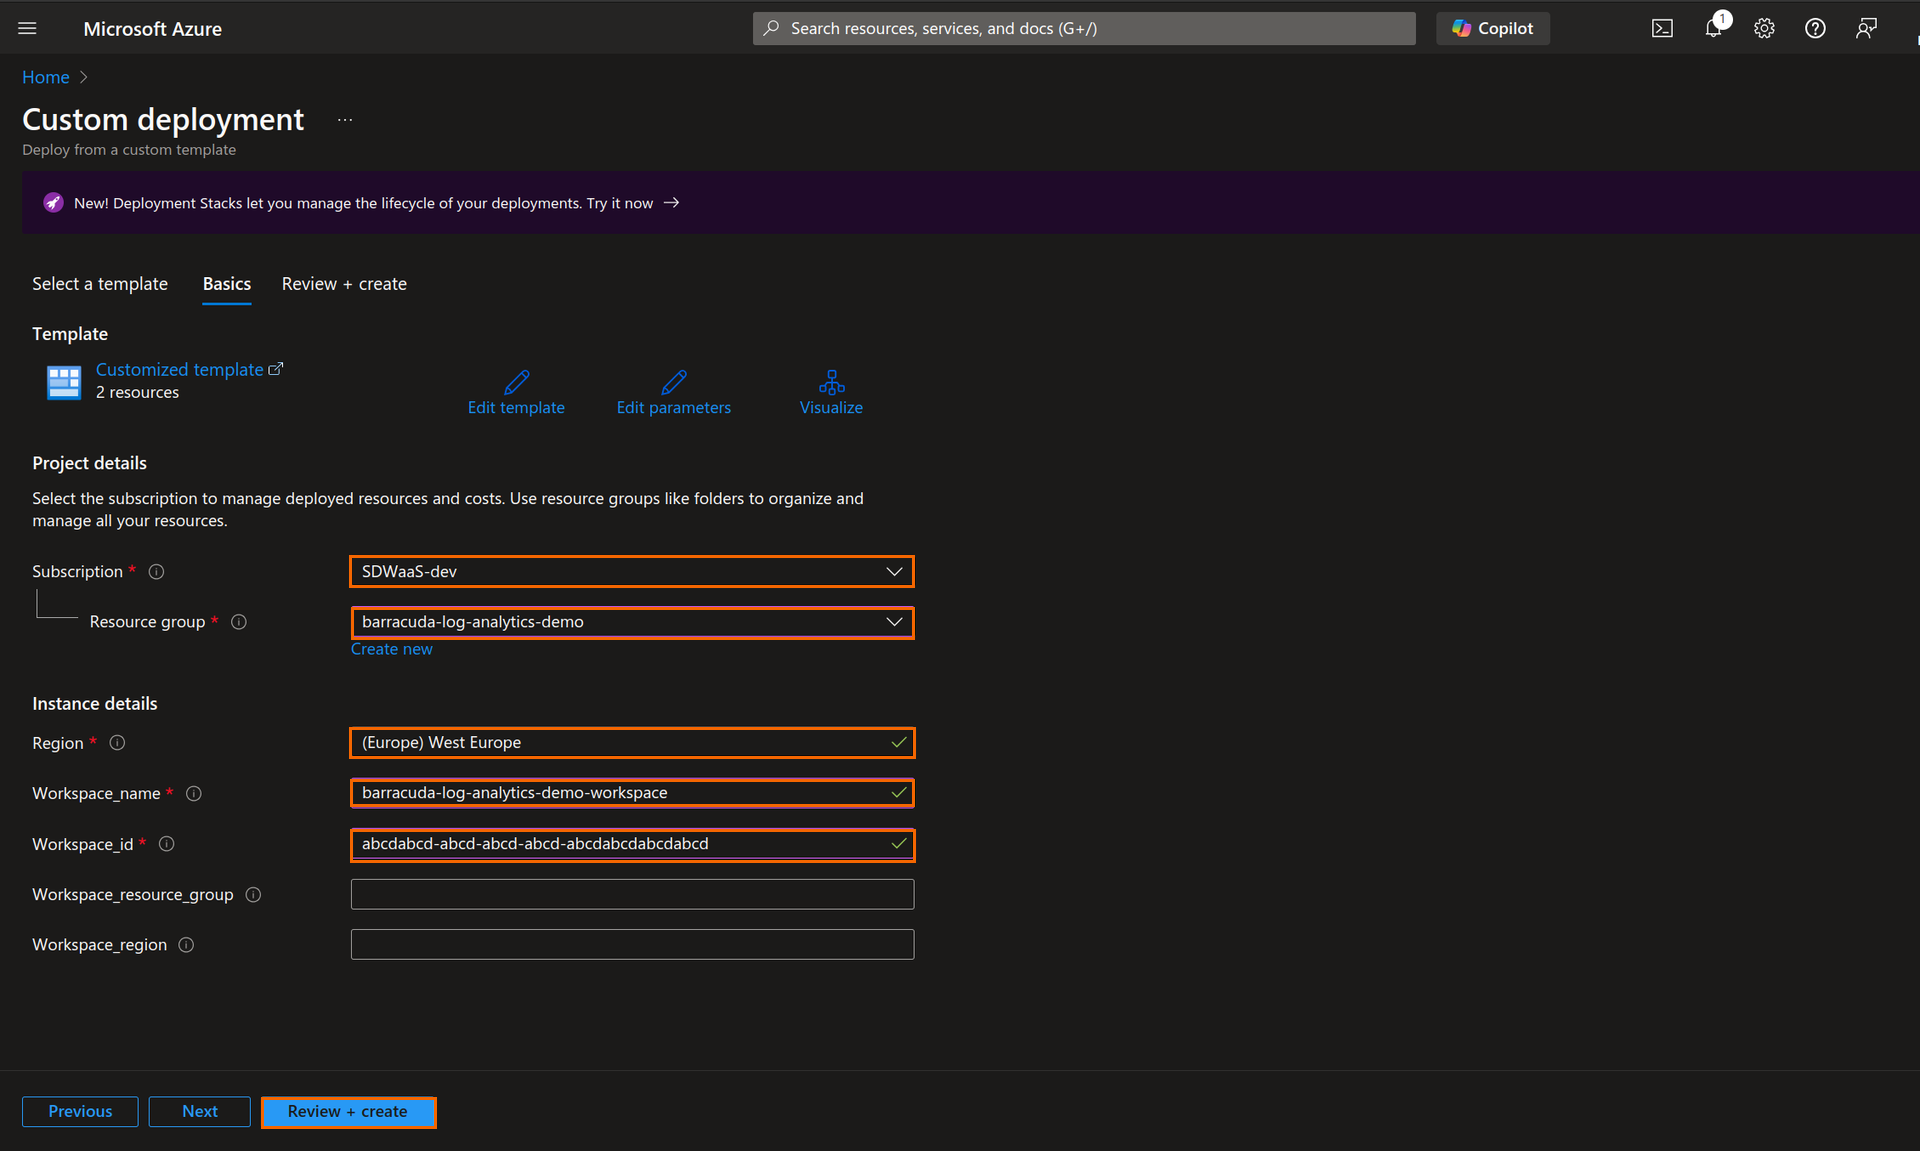
Click Review+Create and run the deployment.
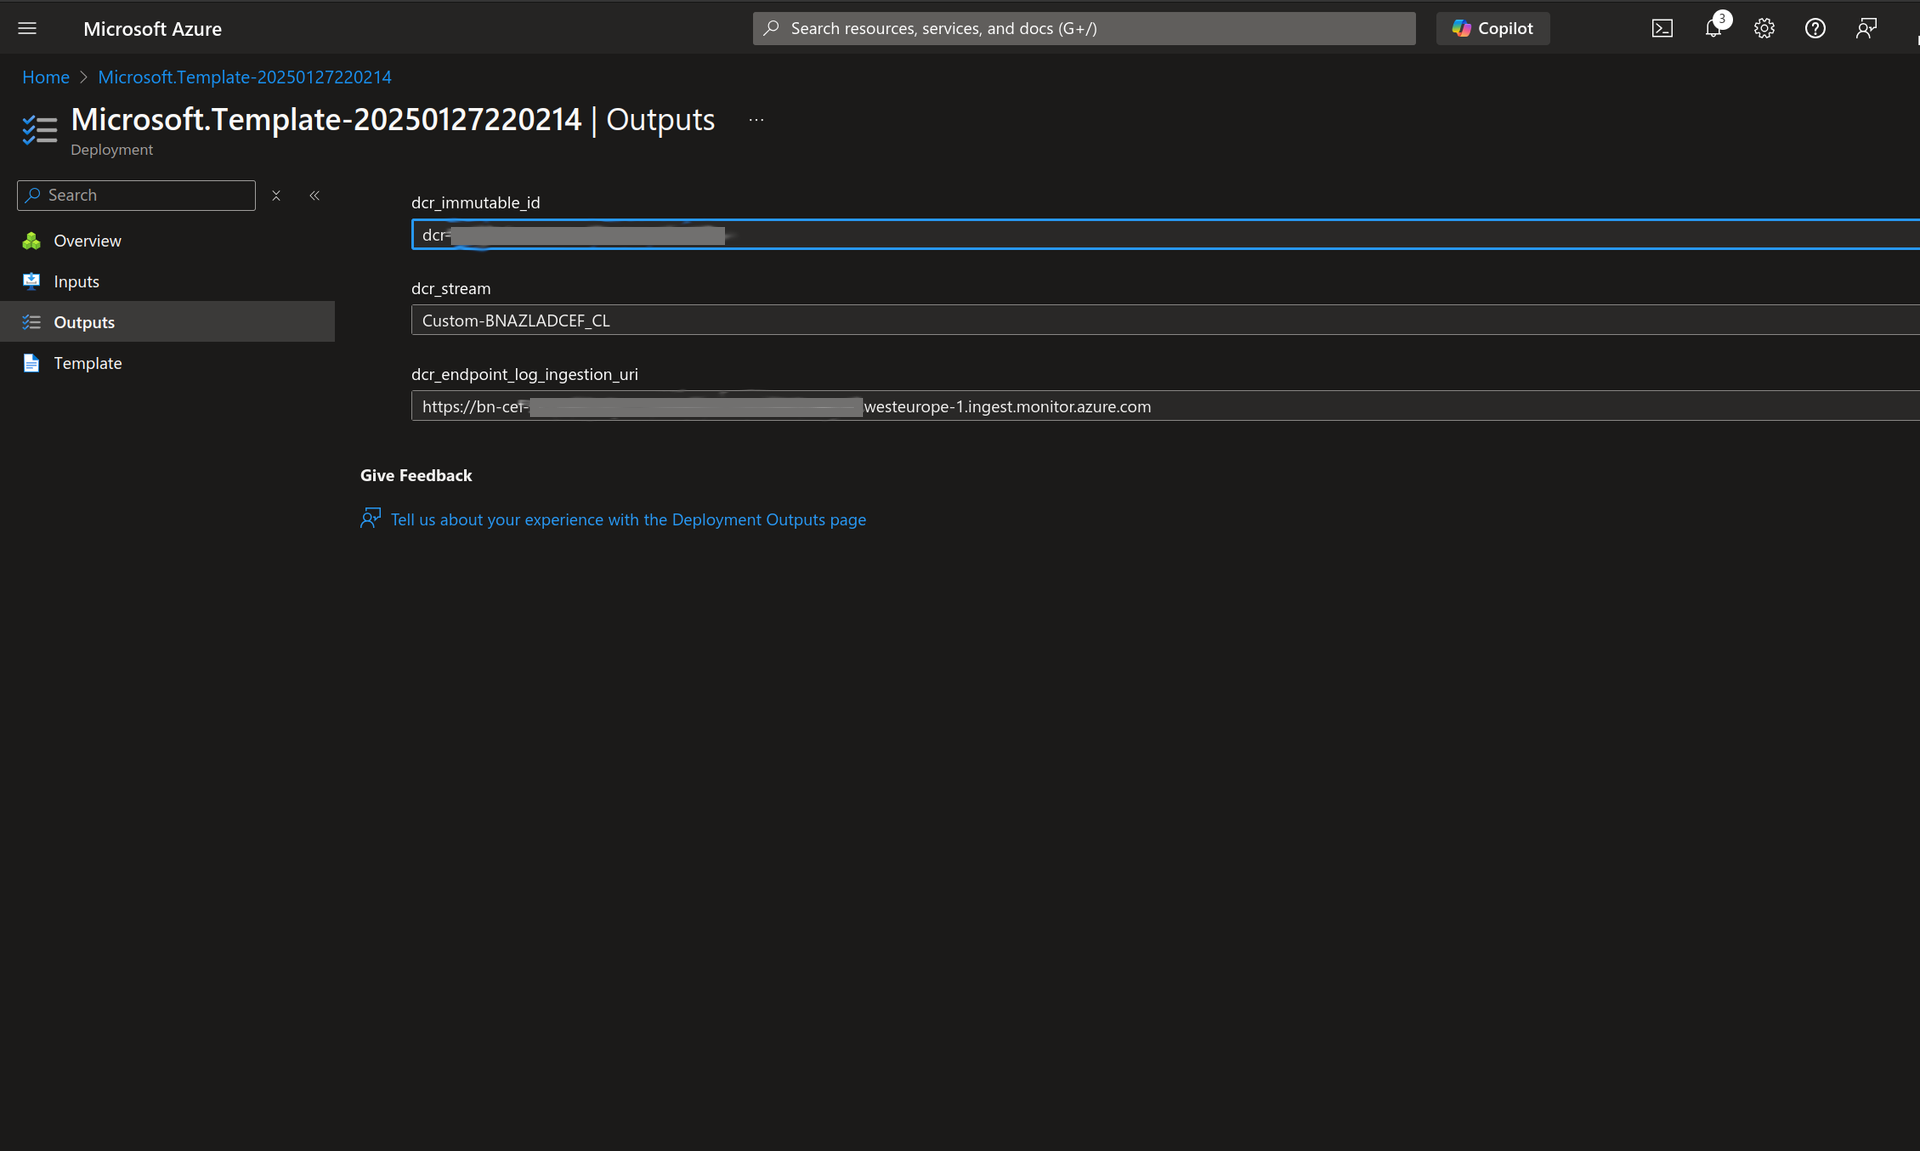
After the deployment is completed, open the Microsoft.Template-<Number of template>I Outputs page and note down the output values of dcr_immutable_id, dcr_stream and the dcr_endpoint_log_ingestion_uri. You require these values in Step 2. You can now proceed with next step.
In addition, the Data Collection Rule template can be also deployed via the Azure PowerShell or CLI.
Sample command for deploying via PowerShell:
New-AzResourceGroupDeployment -TemplateFile <path_to_template_file> -ResourceGroupName <resource_group_to_deploy_into> -workspace_name <target_log_analytics_ws_name> -workspace_id <target_log_analytics_ws_id> -workspace_resource_group <target_log_analytics_ws_resource_group> -workspace_region <target_log_analytics_ws_region>Sample command for deploying the template(s) via the CLI:
$ az deployment group create --template-file <path_to_template_file> -g <resource_group_to_deploy_into> --parameters workspace_name=<target_log_analytics_ws_name> --parameters workspace_id=<target_log_analytics_ws_id> --parameters workspace_resource_group=<target_log_analytics_ws_resource_group> --parameters workspace_region=<target_log_analytics_ws_region>Step 2 Configure the Log Streaming via the Azure Log Analytics Daemon
After the Data Collection Rule is set up, the Azure Monitor log streaming can be configured. In addition to the Data Collection Rule properties from the outputs of the template deployment, a Service Principal with the Monitoring Metrics Publisher role for the Data Collection Rule(s) used for log streaming, and the Log Analytics Workspace are needed in order to configure the authentication.
Go to https://se.barracudanetworks.com and log in with your existing Barracuda Cloud Control account.
In the left menu, click the Tenants/Workspaces icon and select the workspace your Azure Log Analytics daemon can connect to.
Go to Integration > Azure Monitor.
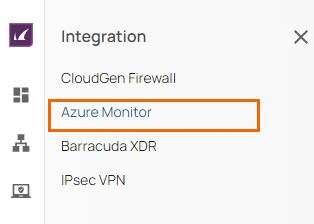
The Azure Monitor page opens.
In the Azure Monitor section, specify values for the following:
Azure Log Analytics Daemon – Click to enable/disable.
When enabled, specify the values for the following:
Client ID – Enter the service principal client ID.
Client Secret – Enter the client password.
Tenant ID – Enter the service principal tenant ID.
Immutable ID – Enter the immutable ID retrieved in Step 1.
Stream – Enter the stream retrieved in Step 1.
Log Ingestion URL – Enter the log ingestion URL retrieved in Step 1.
When disabled, you cannot configure the log streaming.
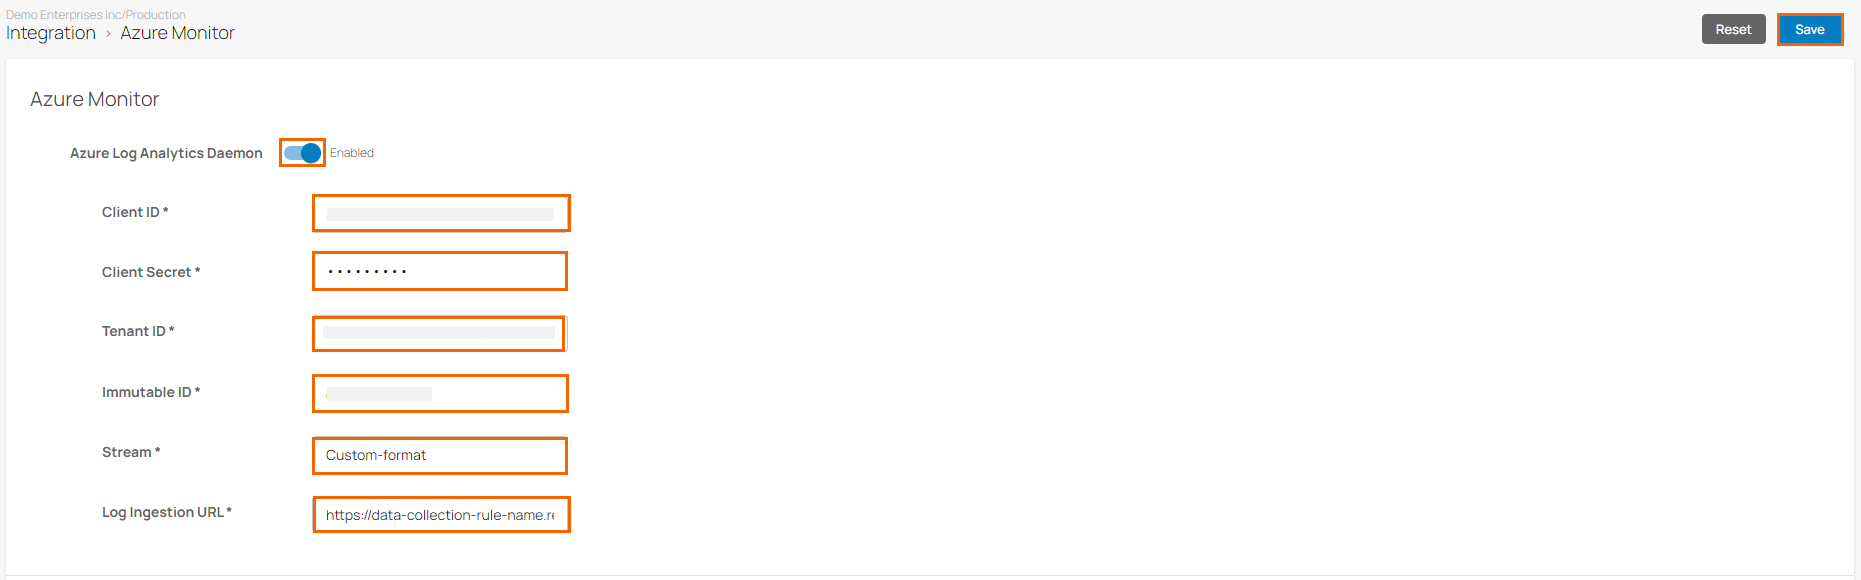
Click Save.
(Optional) Disable Log Analytics
If needed, you can enable the log streaming globally for a workspace. However, you can also disable it for a specific Site.
To disable Log Analytics for a specific Site, do the following:
Go to https://se.barracudanetworks.com and log in with your existing Barracuda Cloud Control account.
In the left menu, click the Tenants/Workspaces icon and select the workspace containing your Site.
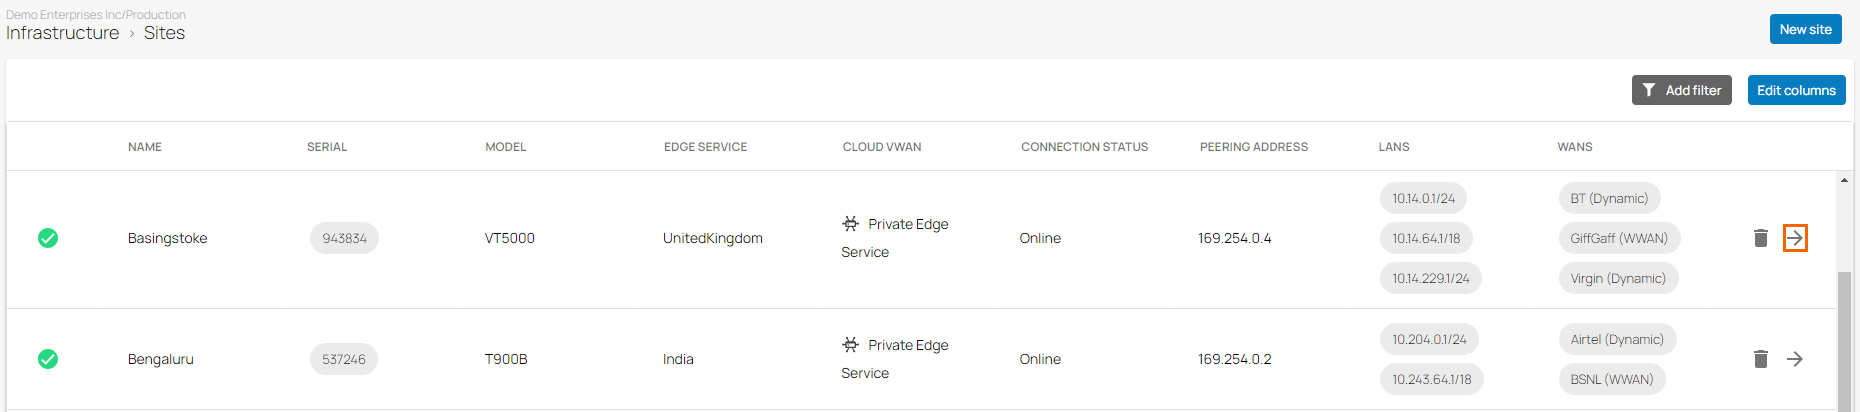
Go to Infrastructure > Sites.
The Sites page opens. Select the Site you wish to disable Log Analytics for.
Click on the arrow icon next to the Site you are interested in.
The selected <Name of Your Site> page opens. In the Sites menu, go to Settings > Advanced Settings.
In the Advanced Settings section, specify the value for the following:
Disable Log Analytics – Click to disable.
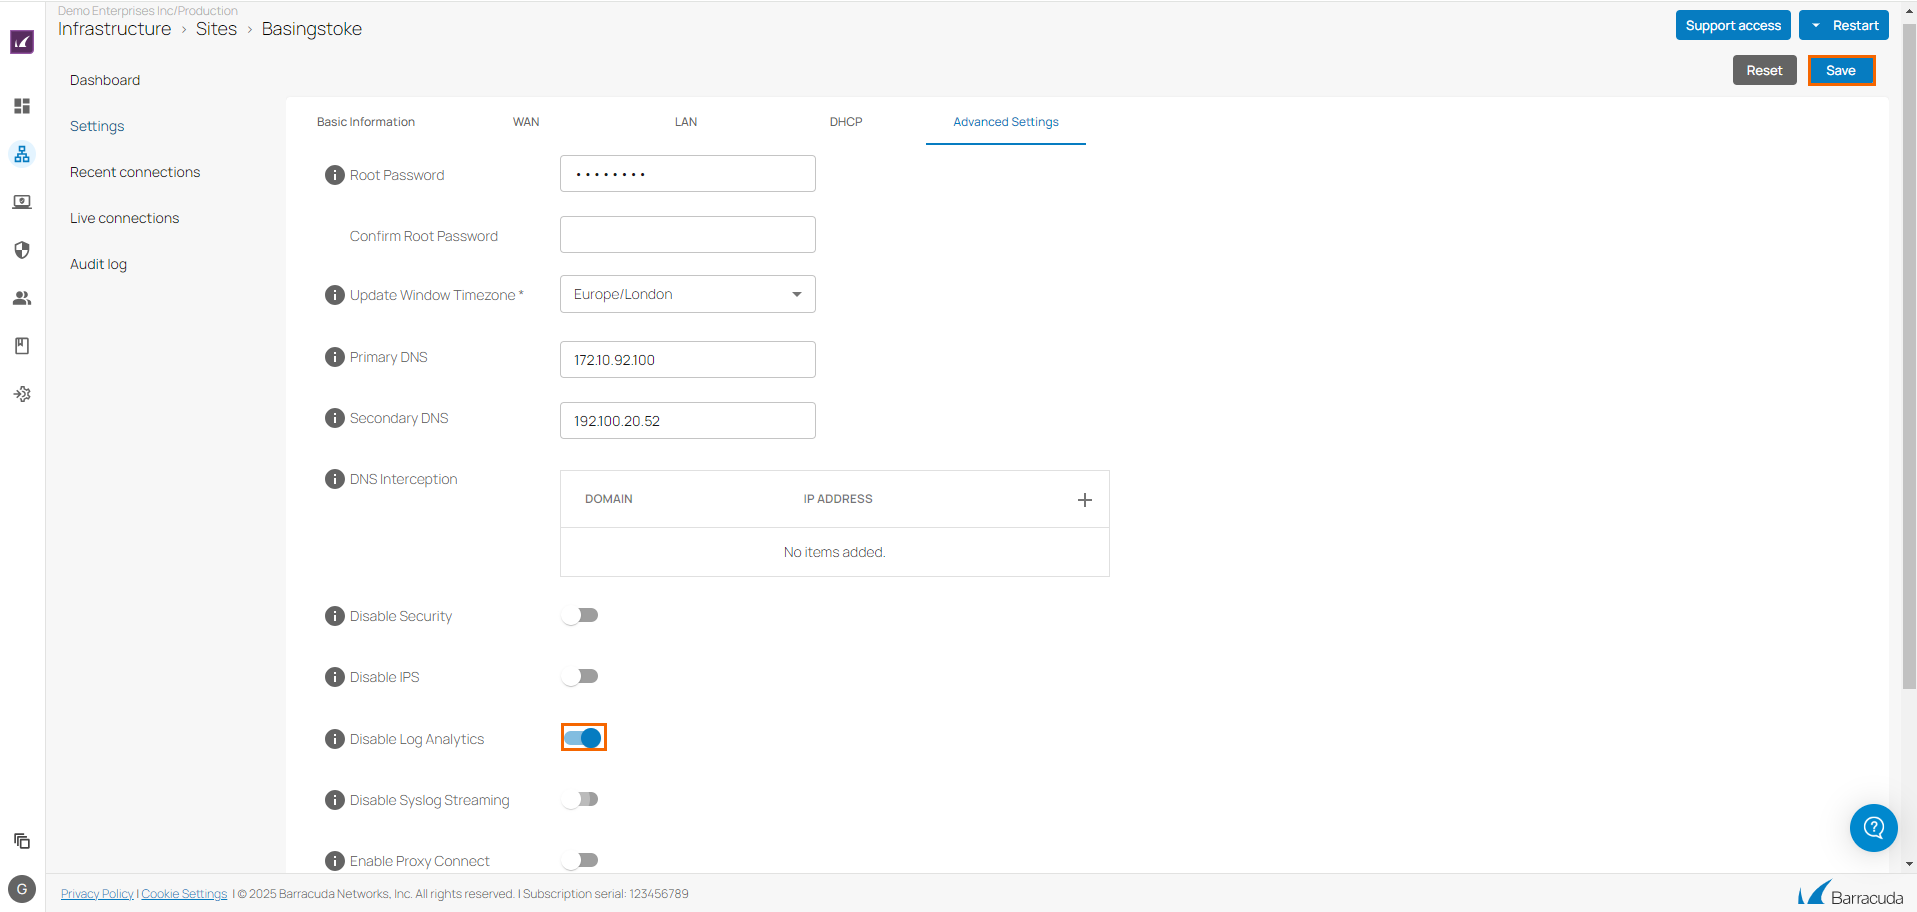
Click Save.
Detailed List of the CEF Logs Streamed to Azure Log Analytics
The following is the list of CEF logs that are streamed to Azure Log Analytics: