You can use Barracuda Web Application Firewall Azure Resource Manager (ARM) template to create and configure a Log Analytics workspace. The Barracuda Web Application Firewall sends the following types of logs to Log Analytics:
- barracuda_CL - This category contains all types of logs generated on the Barracuda Web Application Firewall, i.e., Web Firewall Logs, Access Logs, Audit Logs, Network Firewall Logs, and System Logs. These logs are sent by the Barracuda Web Application Firewall to Log Analytics using the Microsoft Azure Log Analytics-specific format. To view specific types of logs on Log Analytics Workbook, you can perform a query using ‘LogType_s’ field in the barracuda_CL logs. The valid values for LogType_s are:
- TR - Access logs
AUDIT - Audit logs
SYS - System logs
WF - Web firewall logs
NF - Network firewall logs
You can enable/disable these logs in the Barracuda Web Application Firewall web interface either when you are adding the Log Analytics server or by editing it. By default, all logs are enabled, and this is the recommended configuration for maximum visibility.Performance - These are the performance logs of the Barracuda Web Application Firewall virtual machine(s) that are collected by Log Analytics.
Hearbeat - These are the heartbeat logs sent by the Log Analytics agent installed on the Barracuda Web Application Firewall.
The logs (barracuda_CL, Performance and Heartbeat) sent by the Barracuda Web Application Firewall are displayed as the following solutions in Log Analytics:
- Barracuda Application Attack Statistics Dashboard - Displays the graphs and charts based on the analysis of Web Firewall Logs that are sent as “CommonSecurityEvents” by the Barracuda Web Application Firewall. The graphs include:
- Attack Action Statistics
- Attack Severity Distribution
- Application Attack Statistics
- Aggregated Attack Types
- Per Instance Attack Types
- Per Application Attack Types
- Top Attacking Clients
- Top Attacking User Agents

- Barracuda Application Performance Dashboard - Displays the graphs and charts based on the analysis of Access Logs that are sent as “barracuda_CL” by the Barracuda Web Application Firewall. The graphs include:
- HTTP and HTTPS Stats
- HTTP Version Distribution
- HTTP Status Code Distribution
- Requests Over Time Statistics
- Inbound Bandwidth Stats
- Outbound Bandwidth Stats
- Application Response Summary

- Barracuda WAF Monitoring Dashboard - Displays the analysis of the Barracuda Web Application Firewall based on the performance logs that are sent as “Perf” by the Log Analytics agent. The graphs include:
- Average CPU Utilization
- Average Memory Usage
- Average Disk Usage
- Average Network Utilization
- CPU Utilization
- Memory Utilization
- Disk Utilization
- Network Utilization

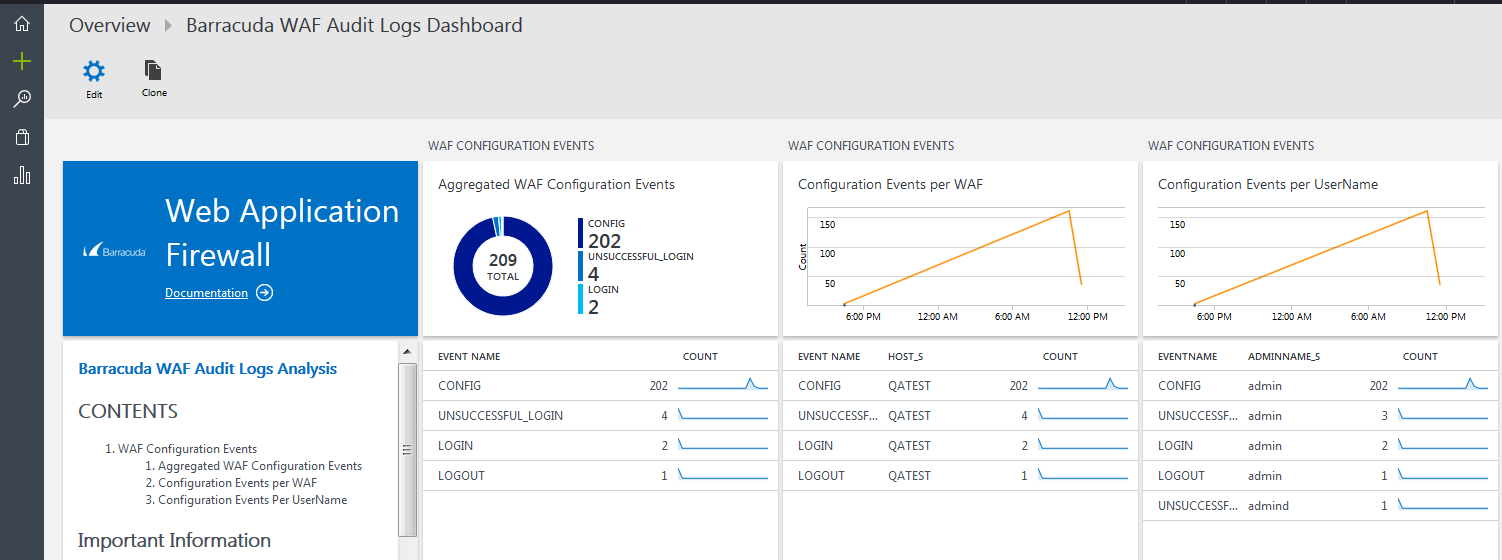
- Barracuda WAF Audit Logs Dashboard - Displays the graphs and charts based on the analysis of Audit Logs that are sent as “barracuda_CL” by the Barracuda Web Application Firewall. The graphs include:
- WAF Configuration Events
- Aggregated WAF Configuration Events
- Configuration Events Per WAF
- Configuration Events Per Username

Next Step
Continue with Creating a Workspace Using the ARM Template.
