

Reports in the Event Points Analysis weigh events on a point basis. This is a form of gamification. Rather than looking at individual users or percentages, you can see, for example, which department performed the best in the last four campaigns.
To assign points, navigate to System > Points Manager. In the Points Manager, you can assign points for each type of action – either positive or negative, depending on whether the action is seen as positive (like reporting potentially harmful phishing emails) or negative (like clicking a suspect link). These point values are used in the Events Points Analysis graphs. In these graphs, each action (like a click) only counts once per person, regardless of how many times they take the action.
Refer to Points Manager for more details.
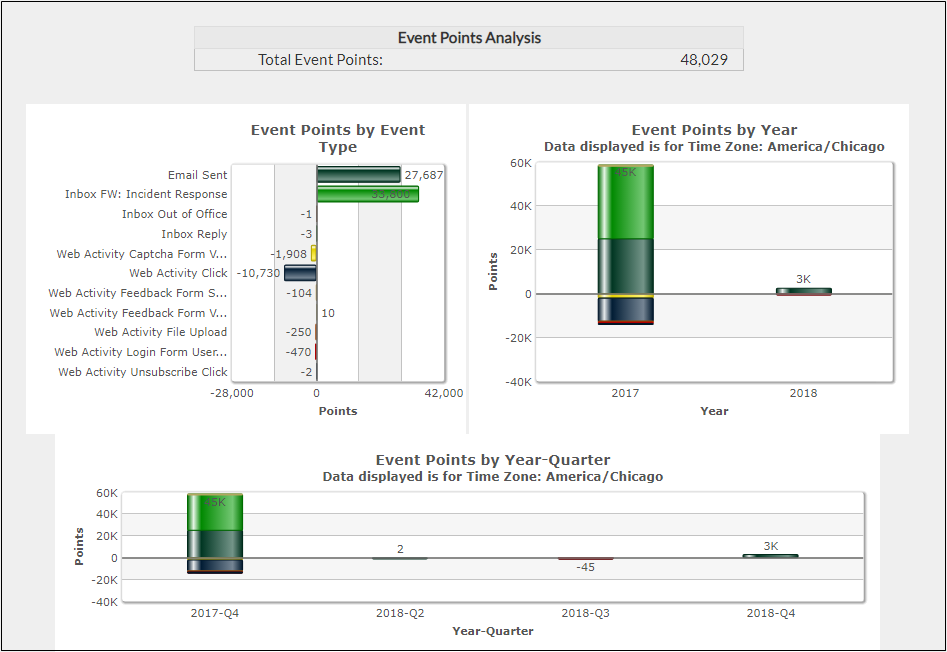
The image below shows a chart of Event Points by Event Type, one of the many charts available in Event Points Analysis.
To work with Event Point Analysis:
- Navigate to Results > Event Point Analysis.
In the left panel, select appropriate filters, for example a
Campaignname orEvent Type.- Click Event Count to see the number of occurrences for each event, presented in a variety of charts.
- Click Event Points to see the Event Count multiplied by the points assigned per event, presented in a variety of charts.
- Click Detail for an overview of the results and ideas for report customization.
Exporting Data
Anything in the Results tables can be exported as a PDF or CSV file. For details, refer to How to Export Data.
Creating Custom Reports
For details, refer to How to Create Custom Reports.