The STATISTICS page provides information about all connections that are established from your firewalls. Before using this feature, you must activate the generation of Firewall Audit data. For information, see: How to Configure the Statistics Services.
To access the STATISTICS page, click the STATISTICS tab.
View Top Statistics
To view a Top statistics data file, expand the Statistics-module list, navigate to the folder containing the file, and double-click the file. From the Top List section on the left of the page, select an instance of the data that you want to view and click Show . The Top statistics for the selected instance display in the table.

To filter the statistics results, you can enter search terms in the Dst Filter field and then click Show.
View Time Statistics
From the Statistics-module list, double-click a Time statistics file. Click Curve or Bars to display the Time statistics in a curve or bar graph. In the Time Interval section on the left of the page, select the data interval that you want to view and click Show. The Time statistics for the the selected interval display in the table.

To view detailed information for a specific area in the chart, right-click it and select Show selected interval.
Statistics File Storage
Raw and cooked statistical data is stored in separate file instances:
- Daily Files – The collected data with the highest time resolution is stored in daily files. Each file contains raw data for one day.
- Cooked Files – After a certain period, data can be compressed to a time resolution of one hour and stored in files that contain multiple days (cooked data). The number of days stored in a compressed (cooked) instance depends on the statistics settings. Cooked instances do not contain minimum and maximum values because they are of no significance.
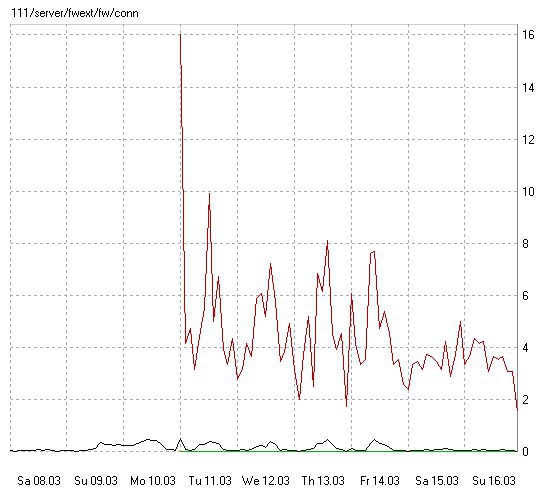
Due to the way that statistical data is stored, you might find that maximum and minimum values are not displayed for certain dates when you view your statistics files - especially for transfer rates (bytes or connections per time unit). For example, the following figure displays firewall connection time statistics from March 8 to March 16, with minimum and maximum values enabled. However, there are no minimum and maximum values displayed for March 8 to 10.
Timed Connection Statistics from March 8:

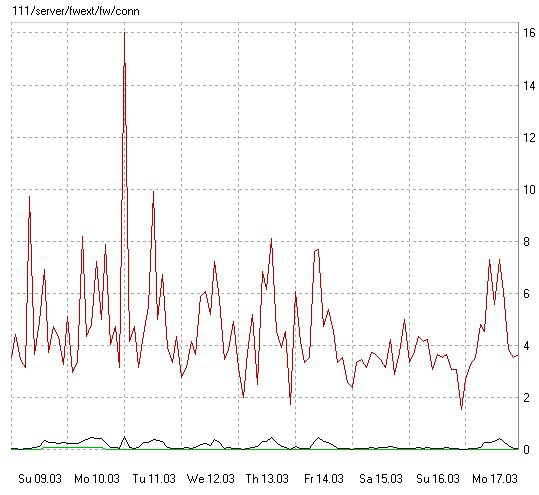
The following example displays the same firewall connection time statistics, starting with March 9 instead of March 8. Unlike the first figure, this second figure displays minimum and maximum values for the entire selected interval because full time resolution is available for March 9 and later. Earlier instances have been cooked and do not contain the minimum and maximum values.
Timed Connection Statistics from March 9:

