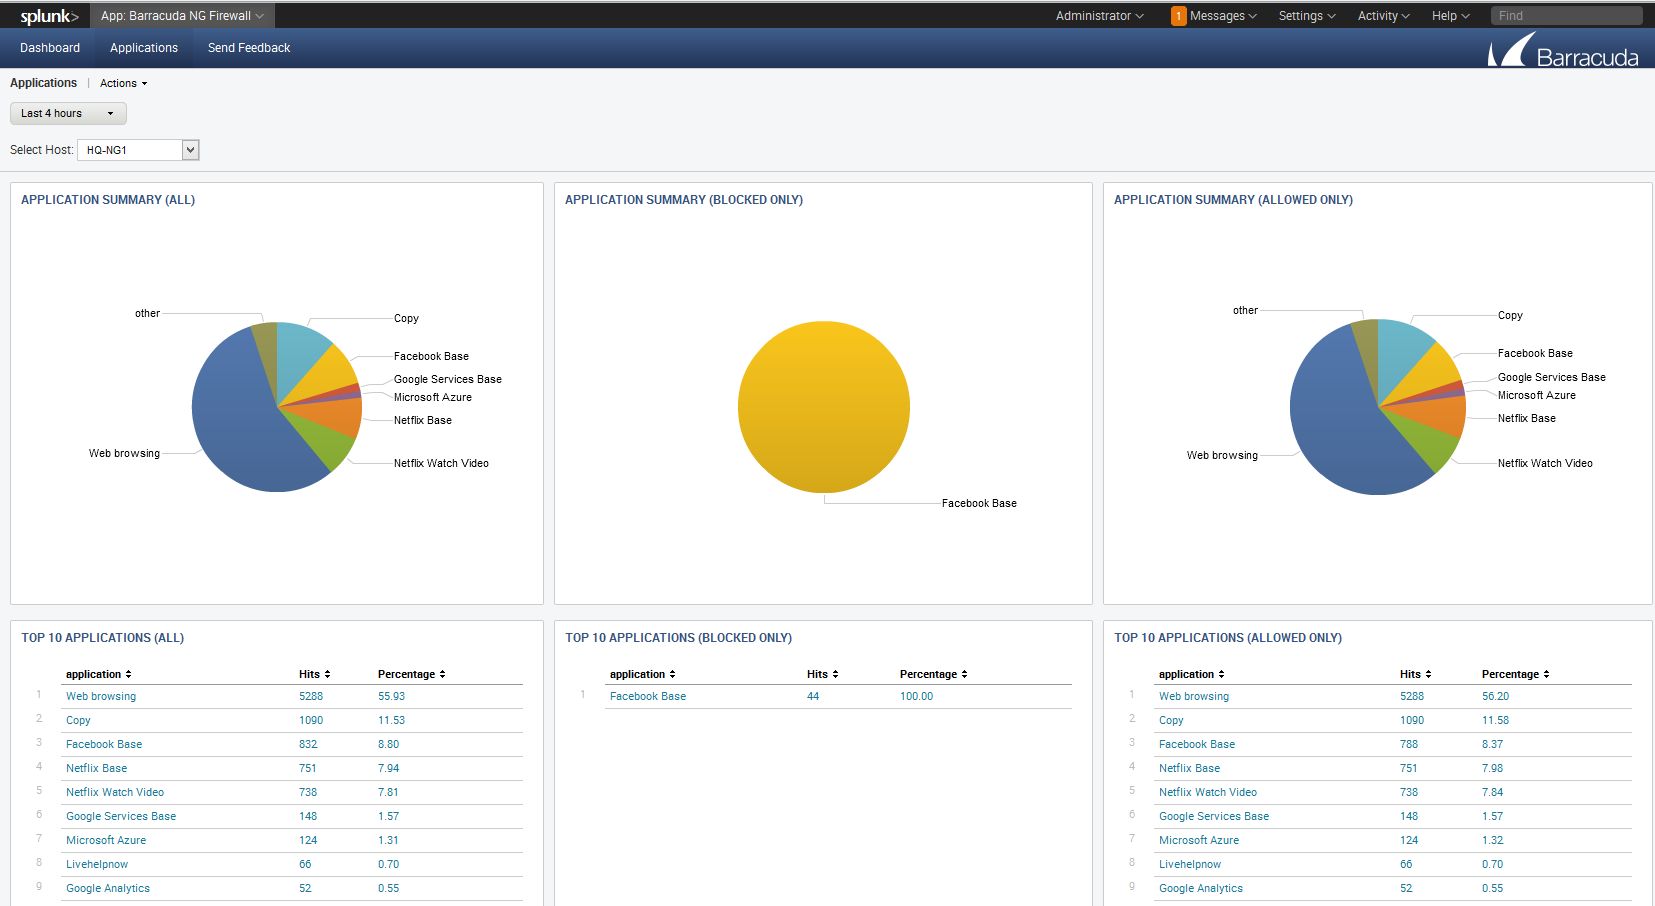
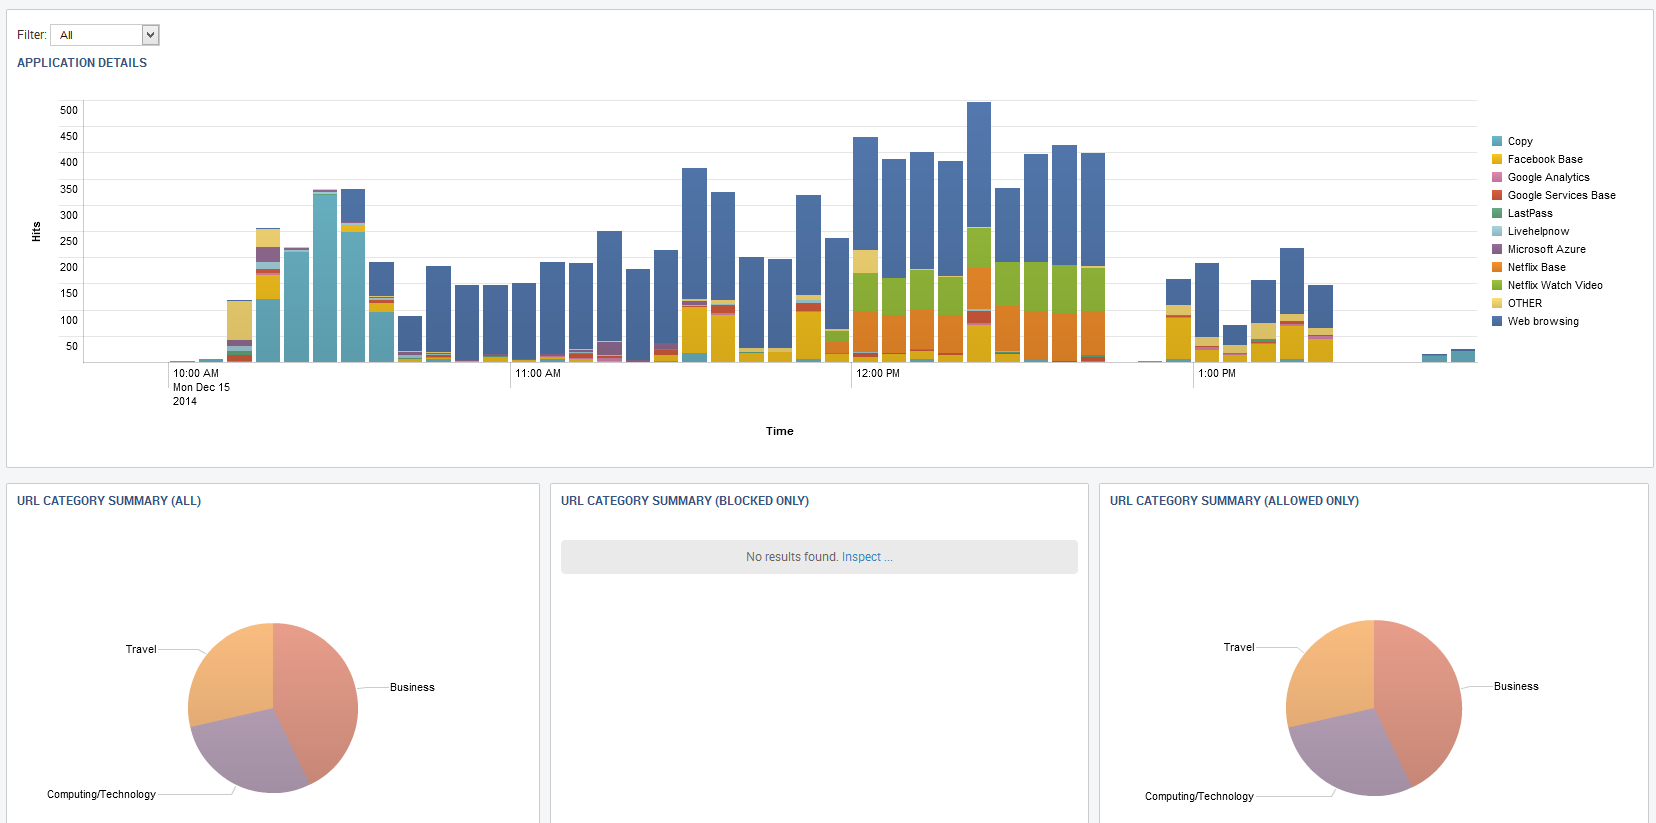
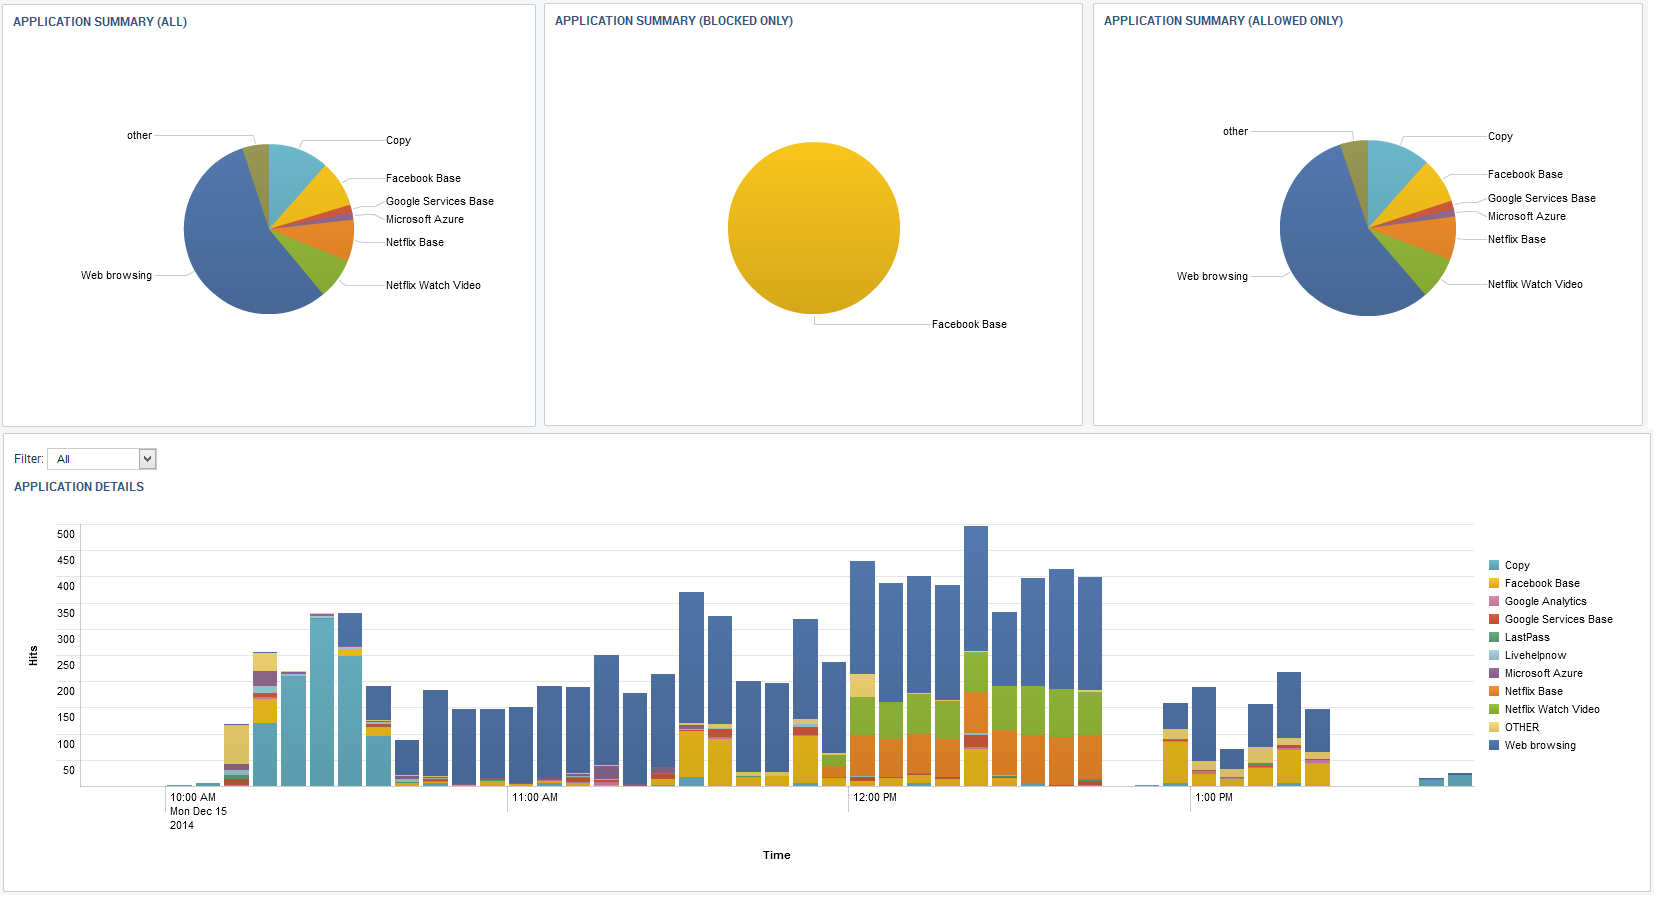
Splunk is a third-party platform for operational intelligence that allows you to monitor websites, application servers, and networks. The Barracuda CloudGen Firewall app shows the information on matched access rules, detected applications, and applied URL filter policies on various fixed and real-time timelines. Data is imported into Splunk via syslog streaming of the Firewall activity log. Currently, the following Splunk versions are supported: 6.0, 6.1, 6.2, 7.x, 8.x, and 9.x.
Before You Begin
- Download the Barracuda CloudGen Firewall Splunk App from the Splunk Marketplace.
- Install the Barracuda CloudGen Firewall Splunk App on your Splunk Server. For more information, see http://docs.splunk.com/Documentation/PCI/2.1.1/Install/InstalltheAppManually.
Step 1. Configure Syslog Streaming on a Barracuda CloudGen Firewall
Configure and enable syslog streaming for every Barracuda CloudGen Firewall you want to include in the Splunk App.
Step 1.1. Enable Syslog Streaming
- Go to CONFIGURATION > Configuration Tree > Box > Infrastructure Services > Syslog Streaming.
- Click Lock.
- Set Enable the Syslog service to yes.

Click Send Changes and Activate.
Step 1.2. Configure Logdata Filters
Define profiles specifying the log file types to be transferred/streamed.
- Go to CONFIGURATION > Configuration Tree > Box > Infrastructure Services > Syslog Streaming.
- In the left menu, select Logdata Filters.
- Click Lock.
- Click the + icon to add a new filter.
- Enter a Name and click OK. The Filters window opens.
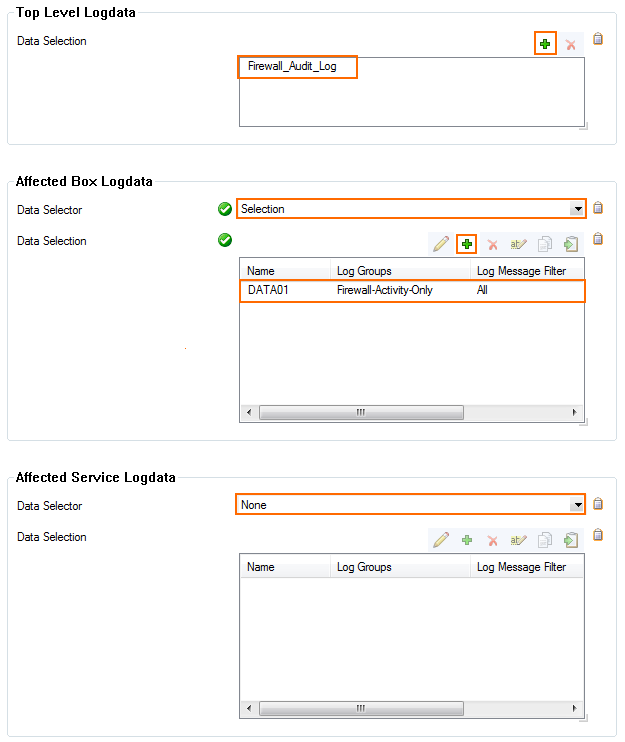
Click + in the Data Selection table and select Firewall_Audit_Log.
- In the Affected Box Logdata section select Selection from the Data Selector dropdown.
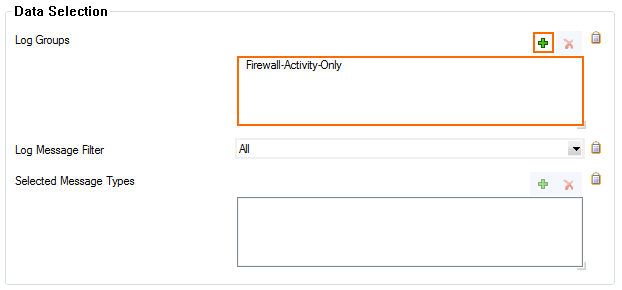
- Click + to add a Data Selection. The Data Selection window opens.
- Enter a Name and click OK.
In the Log Groups table, click + and select Firewall-Activity-Only from the list.
- Click OK.
- In the Affected Service Logdata section, select None from the Data Selector dropdown.
- Click OK.
- Click Send Changes and Activate.
Step 1.3 Configure the Logstream Destinations
Configure the data transfer settings for the Splunk server. You can optionally choose to send all syslog data via an SSL-encrypted connection.
- Go to CONFIGURATION > Configuration Tree > Box > Infrastructure Services > Syslog Streaming.
- In the left menu, select Logstream Destinations.
- Click Lock.
- Click + in the Destinations table. The Destinations window opens.
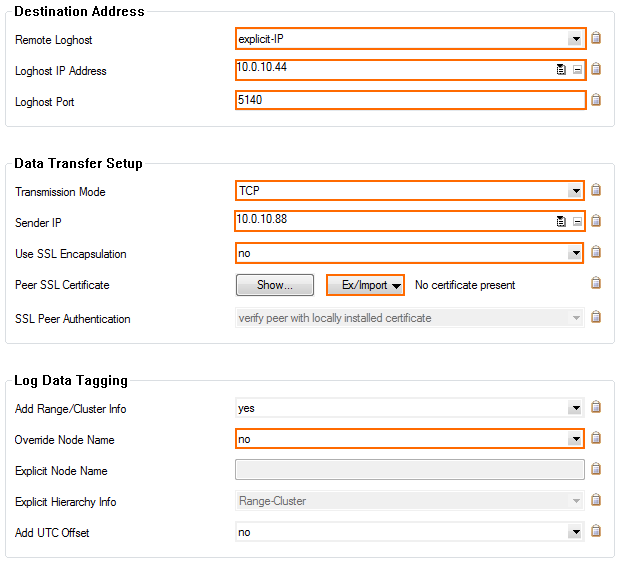
- Configure the Splunk server logstream destination:
- Remote Loghost – Select explicit-IP
Loghost IP Address – Enter the IP address of the Splunk server.
Loghost Port – Enter 5140 for plaintext or 5141 for SSL-encrypted connections.
Transmission Mode – Select TCP or UDP (only for unencrypted connections).
- (optional) Sender IP – Enter the management IP address of the Barracuda CloudGen Firewall or leave it blank for the CloudGen Firewall to do a routing lookup to determine the Sender IP address.
- (optional) Use SSL Encapsulation – Select yes to send the syslog stream over an SSL-encrypted connection.
(optional) Peer SSL Certificate – Import the SSL certificate configured on the Splunk server for this data import.
- Override Node Name – Select no
- Click OK.
- Click Send Changes and Activate.
Step 1.4 Configure Logdata Streams
Create a logdata stream configuration combining the previously configured Log Destinations and Log Filters.
- Go to CONFIGURATION > Configuration Tree > Box > Infrastructure Services > Syslog Streaming.
- In the left menu, select Logdata Streams.
- Click Lock.
- Click + in the Streams table.
- Enter a Name and click OK. The Streams window opens.
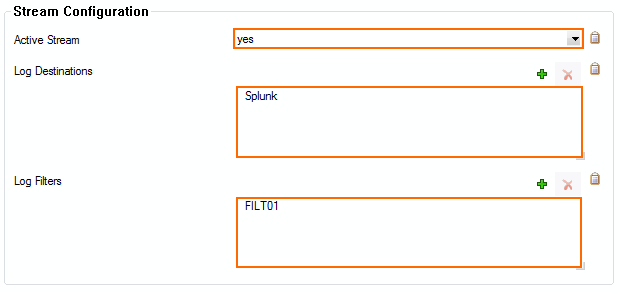
- In the Log Destinations table, click + and select the Log Destination created in Step 1.3.
- In the Log Filters table, click + and select the Log Filter created in Step 1.2.
- Click OK.
- Click Send Changes and Activate.
Step 1.5 Configure Audit and Reporting
Configure the settings for log policies:
- Go to your CloudGen Firewall > Infrastructure Services > General Firewall Configuration.
- In the Configuration Mode section of the left menu, click Switch to Advanced View.
- In the left menu, click Audit and Reporting.
- Click Lock.
- In the section Statistics Policy, set Generate Dashboard Information to yes.
- In the section Statistics Policy, set Generate Monitor Information to yes.

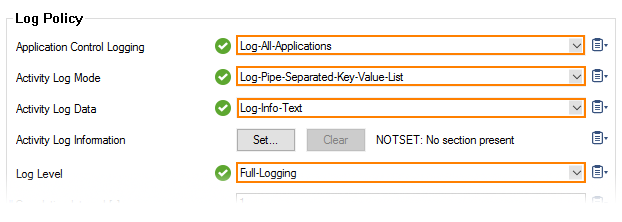
- In the Log Policy section, set Application Control Logging to Log-All-Applications.
- In the Log Policy section, set Activity Log Mode to Log-Pipe-Separated-Value-List.
- In the Log Policy section, set Activity Log Data to Log-Info-Text.
- In the Log Policy section, set Log Level to Full-Logging.
- Click Send Changes.
- Click Activate.
All firewall log data is now being streamed to the Splunk server.
Step 2. Data Input on Splunk
The Splunk server must be configured to receive the syslog data. Verify that you have a Data input entry for TCP or UDP port 5140 or TCP port 5141 (SSL) that listens for the incoming syslog streaming connections. You must use port 5140/5141 because the Barracuda CloudGen Firewall Splunk app can only process data received on these ports. For more information, see http://docs.splunk.com/Documentation/Splunk/6.2.0/Data/Monitornetworkports.
Step 3. (optional) Enable SSL Encryption for Barracuda CloudGen Firewall Splunk App
If you want to SSL encrypt connections with Splunk, you must modify the inputs.conf configuration file for the Barracuda CloudGen Firewall Splunk App.
- Copy your SSL certificates to
/opt/splunk-6.2/etc/auth/server.pemand/opt/splunk-6.2/etc/auth/box-cert.pem. - Login to the Splunk server via SSH.
Edit $SPLUNK_HOME/etc/apps/BarracudaNGFirewall/default/inputs.conf and add a section for SSL:
[SSL]
serverCert = /opt/splunk-6.2/etc/auth/server.pem
password = password
requireClientCert = true
rootCA = /opt/splunk-6.2/etc/box-cert.pem
- Restart Splunk.
Certificate Troubleshooting
If you see log messages containing the string "alert bad certificate" in the bsyslog log file, the rootCA certificate is either missing or invalid. Set requireClientCert to false to disable the certificate check.
2014 12 16 09:43:34 Notice +01:00 Syslog connection established; fd='14', server='AF_INET(127.0.0.1:6224)', local='AF_INET(0.0.0.0:0)' 2014 12 16 09:43:34 Error +01:00 [18697:4146318224] SSL_connect:14094412: error:14094412:SSL outines:SSL3_READ_BYTES:sslv3 alert bad certificate
Step 4. Enable Application Logging in the Firewall
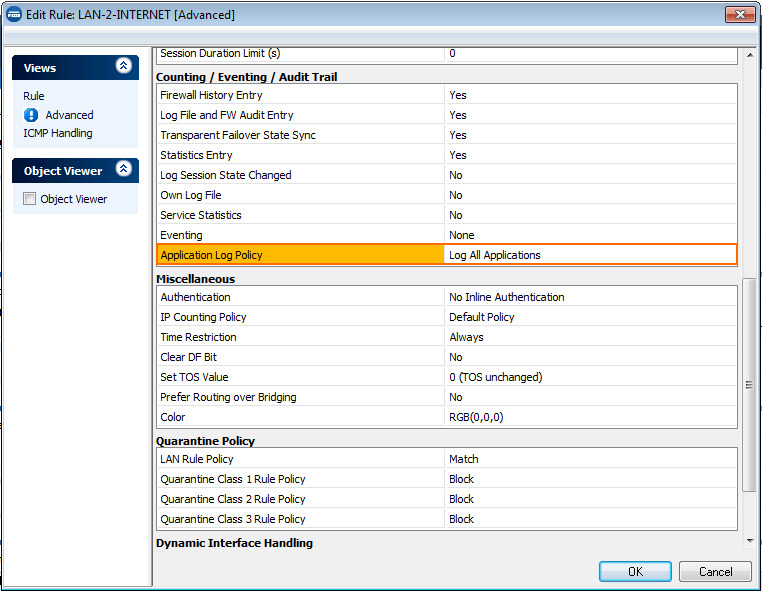
Application data is collected on a per-access rule basis. Set the Application Log Policy to Log All Applications in the Advanced Firewall Rule Settings for each access rule that matches the traffic you want to include in the data collected on the Splunk server. For more information, see Advanced Access Rule Settings.
Step 5. The Barracuda CloudGen Firewall Splunk App
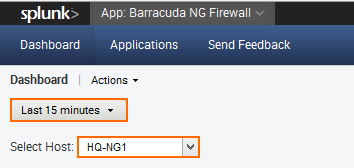
Log into Splunk, and click on the Barracuda CloudGen Firewall app on the Splunk dashboard. Select the Barracuda CloudGen Firewall from the Select Host dropdown menu, and then select the time span for the query.
Barracuda CloudGen Firewall Dashboard
The app allows you to display connection information based on a fixed time period or in real time via Barracuda CloudGen Firewall host.

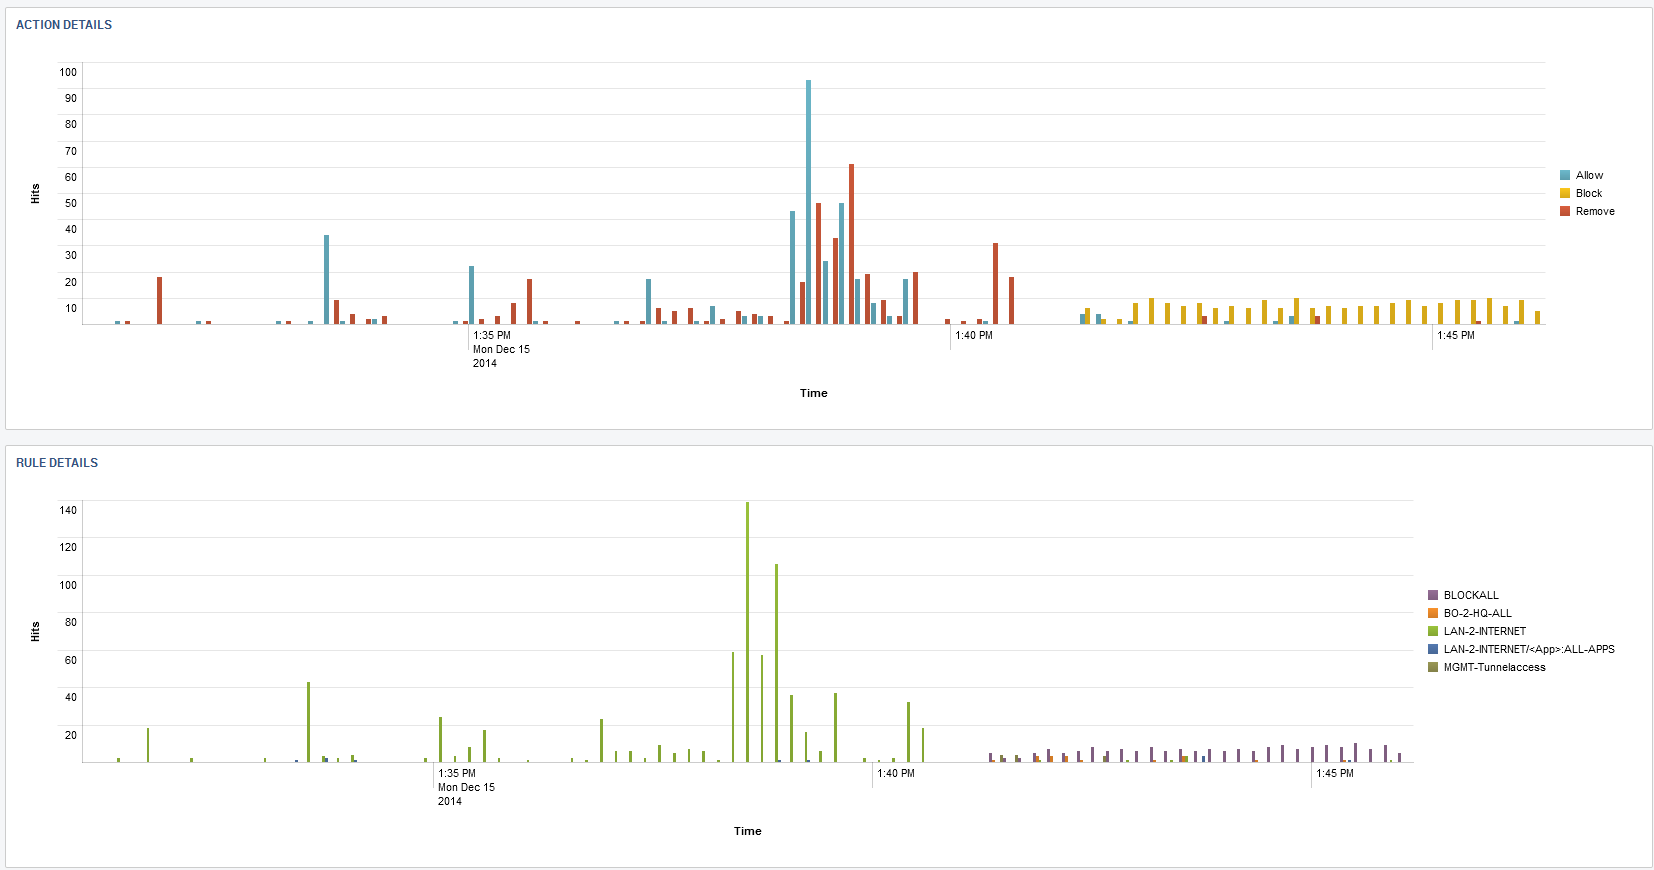
Barracuda CloudGen Firewall Applications
Click on the Applications tab of the Barracuda CloudGen Firewall Splunk plugin to view Application Control 2.0 data, such as detected and blocked applications and websites blocked by URL Filter policies.
