

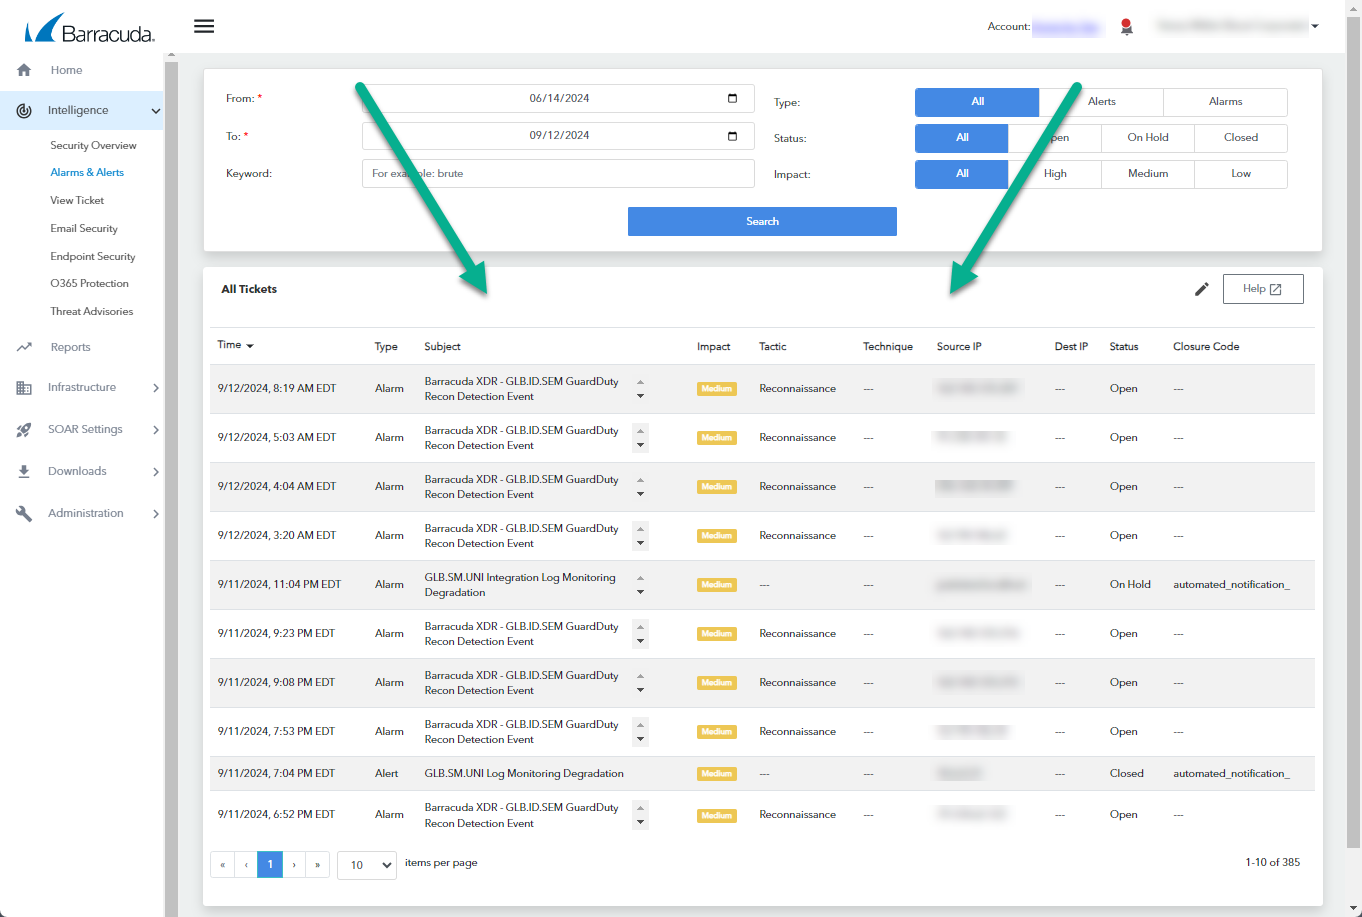
The Alerts & Alarms page displays a list of tickets by reverse chronological order. The tickets displayed are affected by the filters chosen, whether you choose to filter by date range, account, ticket status, or any other filter. For more information on filtering, see Filtering the Alarms & Alerts Page .
This list contains the time the ticket was created, the type of incident, the subject of the ticket, the ticket's impact, the source and destination IP addresses, the status, and closure code. You can also click any ticket to see any additional information that was included in the ticket.
Raw Events
The Raw Event field shows information on the event that triggered the incident, in an unprocessed state. This data will be in its raw format or protocol, whether that is xml, json, or syslog.
To view tickets on the Network & Log Dashboard
In Barracuda XDR Dashboard, click Intelligence > Alarms & Alerts.
Scroll down to the All Tickets section.
To view the ticket summary
In Barracuda XDR Dashboard, click Intelligence > Alarms & Alerts.
Scroll down to the All Tickets section.
Click a ticket you want to see more information on.
To view details
In Barracuda XDR Dashboard, click Intelligence > Alarms & Alerts.
Scroll down to the All Tickets section.
Click a ticket you want to see more information on.
Click View Ticket Details
 .
.