The General page displays a summary of the Barracuda CloudGen Firewall system status. To access the General page, open the DASHBOARD tab and click the General icon in the ribbon bar.
The following elements are available:
- Appliance
- Status
- Interfaces
- Message Board
- Subscription Status
- Updates
- Services
- Overall Throughput
- Resources
- Administrators logged in
- Events
- Cloud Information
Appliance
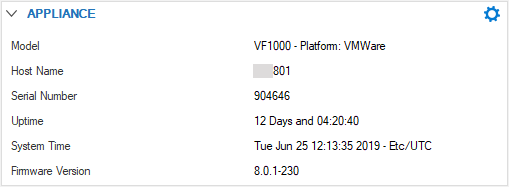
The Appliance element displays information about your system, such as product model, hostname, serial number, etc.
The Control Center section indicates if the firewall is centrally managed by a Barracuda Firewall Control Center and shows the IP address of the corresponding appliance. If the system is part of a high availability (HA) cluster, an additional section (HA Secondary) displays the IP address of the secondary unit.
Status
The Status element displays the status of the services running on the firewall. It also shows the health status of network connections and the licensing status of the system.
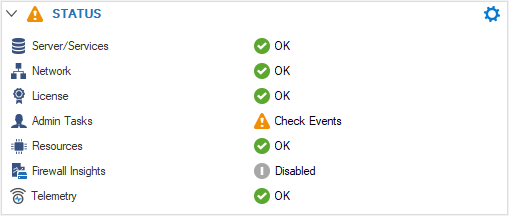
The Admin Tasks section indicates if events were generated and if actions should be taken by the administrator. The Resources section shows the status of system resources.
Interfaces
The Interfaces element shows the port configuration for your firewall. The color of the port (light or dark gray) shows if a valid configuration for this port is present. The colored status overlay shows the connectivity of the port: unplugged, connected with less than full speed, or connected with full speed. All ports are displayed in the same location and with the same port names as on the physical appliance. The mouse-over for each port shows the configured IP addresses and direct-attached network routes as well as the connection information. All bridges and Ethernet bundles are listed below the port diagram. The mouse-over for the bridging and Ethernet bundle interfaces highlights the associated ports in the interface element and, if applicable, also displays the IP addresses or networks associated with the device. Built-in network switches, like on models F180/280, are inidcated as connected to the firewall via a green overlay. In case virtual routers are configured, each namespace of a virtual router is displayed with its assigned interfaces. Hovering over the namespace highlights the interfaces in the related color.
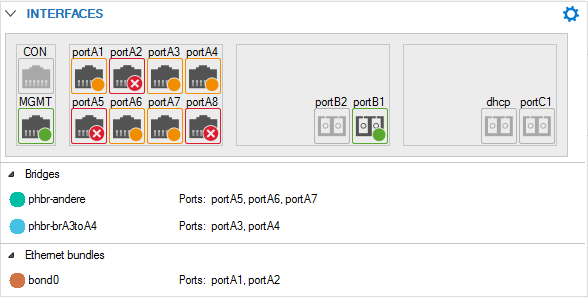
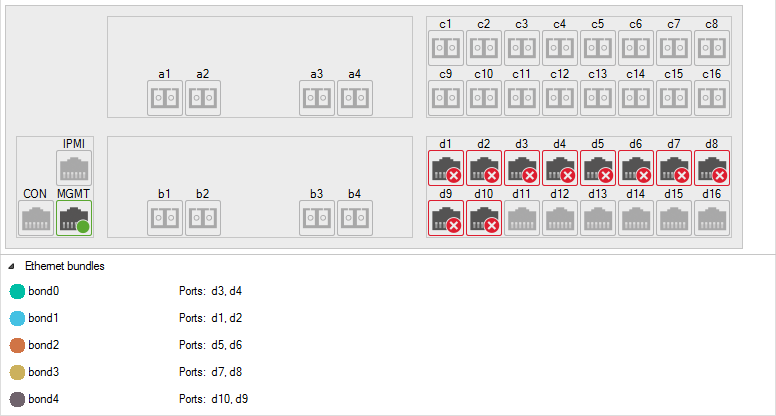
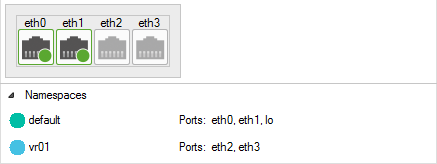
Port Types
| Port Icon | Port Type |
|---|---|
 | SFP or SFP+ |
 | RJ45 |
Port States
| Port Icon | Port Configured on CloudGen Firewall | Cable Plugged In |
|---|---|---|
  | No | n/a |
 | Yes | No |
 | Yes | Yes, using the rated speed of this port. E.g., 1 GB port connected to a GB switch. |
 | Yes | Yes, using a lower speed than the rated speed of the port. E.g., 1 GB port connected to a 100 Mbit switch. |
Message Board
The Message Board element displays communication from Barracuda Networks, the welcome message, and the Barracuda warranty and software license agreement. Product Tips is only enabled for freshly installed units. Go to CONFIGURATION > Configuration Tree > Box > Advanced Configuration > Message Board and enable Barracuda Networks product Tips to receive product tips on updated units.
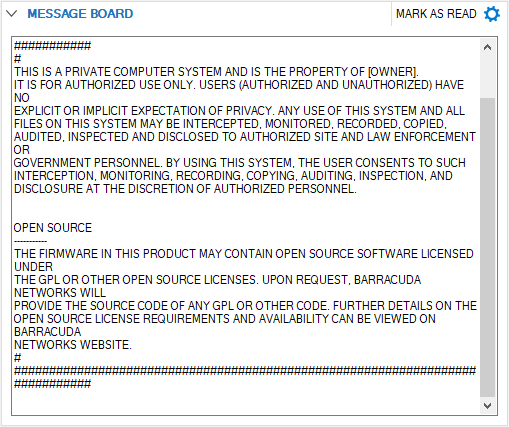
To clear the message of the day, click Mark as Read.
Subscription Status
The Subscription Status element displays the current license, subscriptions, and activation state of the firewall.
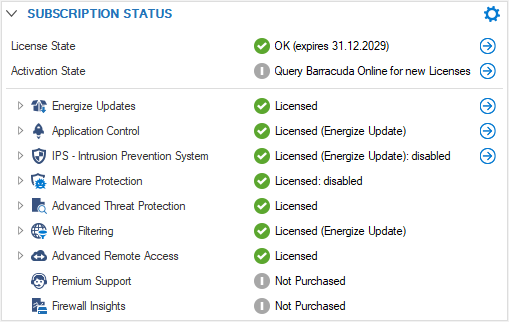
The icon displayed depends on whether the firewall is licensed, whether the firewall is running in grace mode, and whether a licensed service is enabled. The following table shows the type of icon with regards to any combination of these states:
Icon | Displayed Status | Service Licensed | Firewall in Grace Mode | Service Enabled |
|---|---|---|---|---|
 | Green (OK) | Yes | No | - |
| Yellow (Warning) | Yes | Yes | - | |
 | Red (Error) | No | - | Yes |
 | Gray (Not Available) | No | - | No |
Inside a subscription block, each feature is described by its individual attributes.
Blue arrows to the right of each subscription line indicate options that can be displayed or modified by clicking the associated link entry.
Updates
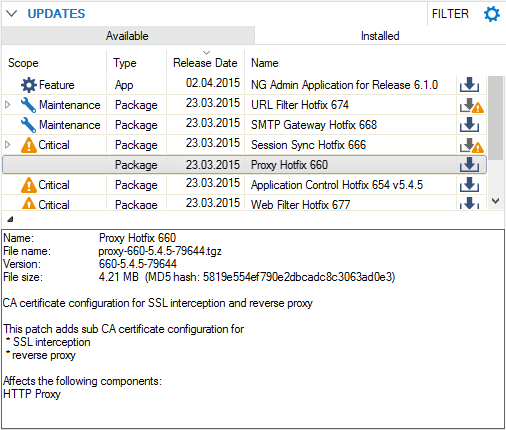
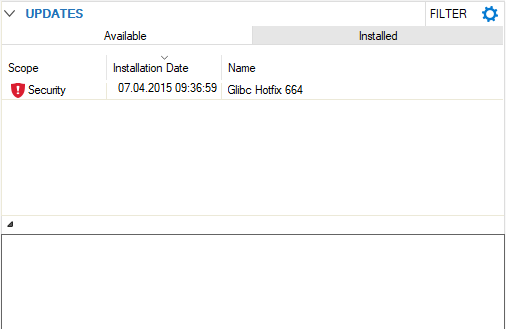
The Updates element shows all available and installed updates for your CloudGen Firewall. Click the download icon (![]() ) to download the update archive. Click the Installed tab to see which updates or hotfixes are already installed on this unit. By default, the update element is disabled. To enable Update Notifications, go to CONFIGURATION > Configuration Tree > Advanced Configuration > Firmware Update.
) to download the update archive. Click the Installed tab to see which updates or hotfixes are already installed on this unit. By default, the update element is disabled. To enable Update Notifications, go to CONFIGURATION > Configuration Tree > Advanced Configuration > Firmware Update.
Download and Install Options
The Updates element provides several functions when clicking the download icon (![]() next to a link.
next to a link.
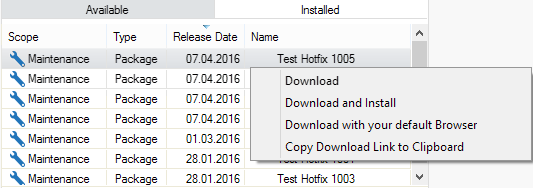
- Download – Downloads the update file and adds an arrow icon to the link. Click this icon to install or remove the file.

- Download and Install – Downloads and installs the update file.
- Download with your default Browser – Opens an Explorer window and lets you chose the file location.
- Copy Download Link to Clipboard – Copies the download link to the clipboard, e.g., https://d.barracudanetworks.com/ngfirewall/hotfixes/7.0.x/test-1020-7.0.0-1.tgz
Update Dependencies
Some updates require installation of earlier download files. To view dependency chains, expand the link.

Downloads with unmet dependencies are marked with a yellow warning triangle (![]() ). Expand the item and install all dependencies to install this update.
). Expand the item and install all dependencies to install this update.
Blocked downloads are marked with a red warning icon (![]() ) that becomes visible when hovering the mouse over the link.
) that becomes visible when hovering the mouse over the link.

Services
The Services element shows the status (enabled or disabled) of box services running on the firewall.

Clicking the arrow icons next to the entries provides the corresponding links to the Services page, where you can view the status of your and services.
Overall Throughput
The Overall Throughput element provides a live view of the overall traffic handled by the system.
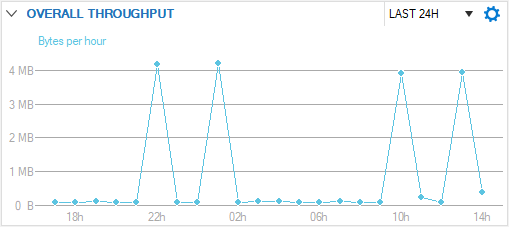
Click the link on the top right of the element (Last 24H) to change the time display interval.
Resources
The upper section of the Resources element displays the system load (CPU Load) and the amount of RAM (Memory Usage) used and still available.
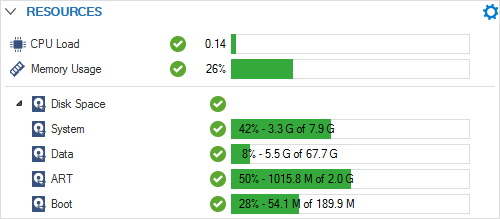
Expanding the Disk Space section, which displays the used and available disk space, provides the following information about your system resources:
- System – Displays the used and available disk space of the system partition (root).
- Data – Displays the used and available disk space of the data partition (/phion0).
- ART – Displays the used and available ART disk space.
- Boot – Displays the used and available Boot disk space.
Administrators Logged In
This element displays details about connected administrators.

Recent Severe Events
This element displays a list of recent events with a severity of warning and above.

Cloud Information
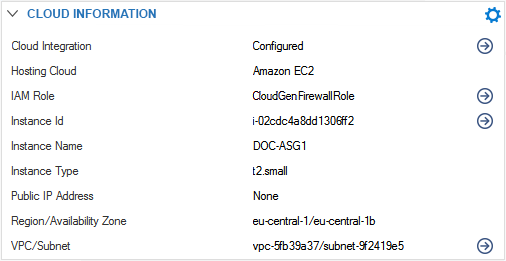
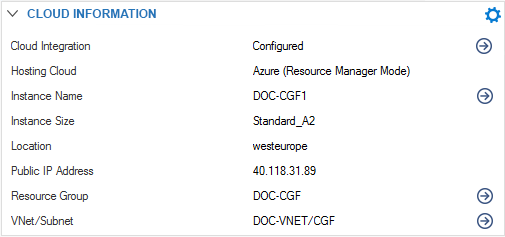
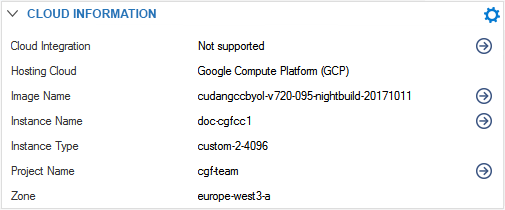
The Cloud Information element shows which cloud the firewall is running in (Azure, AWS, or Google Cloud) and if it is connected to the cloud fabric. It also displays the name of the VM instance in the cloud. This makes it easier to find your firewall VM in the AWS, Azure, and Google Cloud management portals.
