The Live tab lets you view and filter real-time information for the traffic that passes through the Barracuda CloudGen Firewall. You can also manage the traffic sessions. To access the Live page, click the FIREWALL tab and select the Live icon in the ribbon bar.
Video
To get a feel for how to use the FIREWALL > Live page in Firewall Admin, watch the following video:

Videolink:
https://campus.barracuda.com/The Live Tab
The Live tab provides three separate sections
Session Details
Work Processes
Traffic Meter
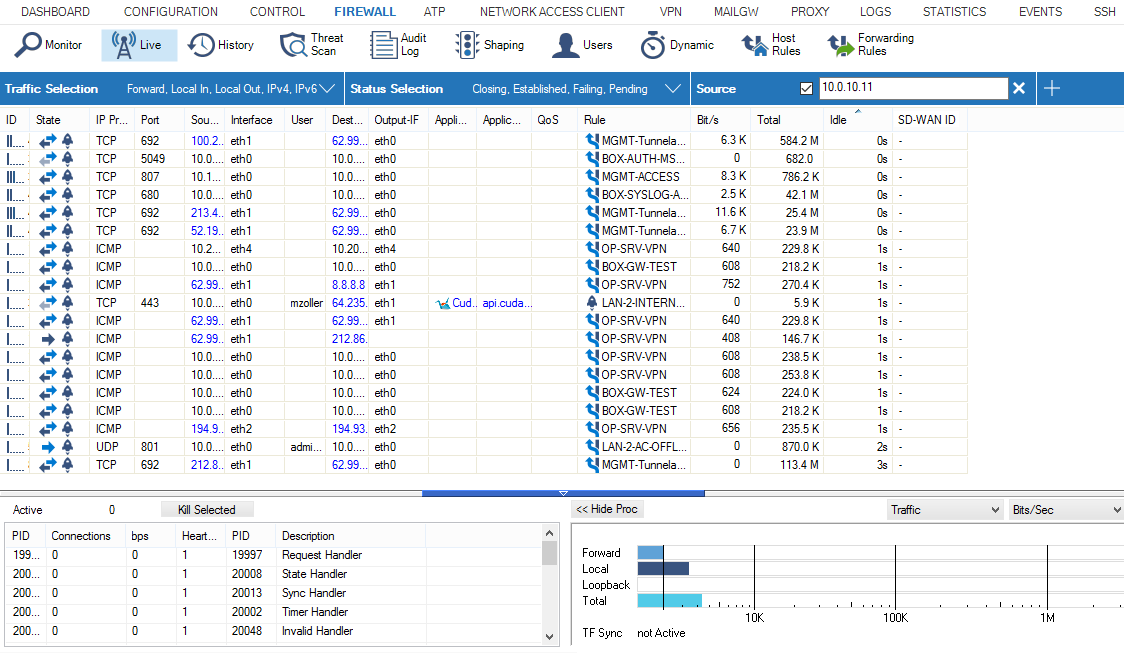
The Live page provides the following information for each session:
ID – The icons indicate the amount of traffic (Low to High...). The number provided is the unique access ID for the connection.
Status – The connection status: One-way traffic; connection established (TCP); two-way traffic (all other); connection could not be established; closing the connection. The icon next to the status symbol indicates the application policy.
IP Protocol – The protocol used. If the protocol can be determined only by the source/destination port, it is displayed in light-gray. If the protocol was detected by the firewall engine it is displayed in black. For example, TCP, UDP, or ICMP.
Application – The name of the affected application, e.g., Web browsing, Ubuntu Update.
Application Context – The context of the affected application., e.g., www.barracuda.com
Rule – The name of the affected firewall rule.
Type – The origin, as specified by the following abbreviations:
LIN – Local In. The incoming traffic on the box firewall.
LOUT – Local Out. The outgoing traffic from the box firewall.
LB – Loopback. The traffic via the loopback interface.
FWD – Forwarding. The outbound traffic via the Forwarding Firewall.
IFWD – Inbound Forwarding. The inbound traffic to the firewall.
PXY – Proxy. The outbound traffic via the proxy.
IPXY – Inbound Proxy. The inbound traffic via the proxy.
TAP – Transparent Application Proxying. The traffic via stream forwarding.
Source – The source IP address.
Src. Port – The source port.
Destination – The destination IP address.
Port – The destination port (or internal ICMP ID).
User – The username of the affected user and group.
bit/s – The bits per second (during the last second).
Idle – Time since the last data transfer.
Total – The total number of bytes transferred over this connection.
In – The total number of bytes transferred over this connection from the source.
Out – The total number of bytes transferred over this connection to the source.
Start – Time since the connection was established.
SNAT – The source NAT address.
DNAT – The destination NAT address.
Output-IF – The outgoing interface.
Policy – The affected policy. For descriptions of the available policies, see the Policy Overview section below.
QoS – QoS band that is used in this session.
FWD Shape – The forward Traffic Shaping (IN/OUT). The shape connectors for ingress and egress shaping, respectively, are in the forward direction. Ingress shaping takes place at the inbound interface. Egress shaping takes place at the outbound interface.
REV Shape – The reverse Traffic Shaping (IN/OUT).
Protocol – The affected protocol.
User Agent – User agent for HTTP and HTTPS connections.
Src. Named Network – The compound string of a named network used for a source.
Example:example.com///Location-51/Department-18/Devices-3Dst. Named Network – The compound string of a named network used for a destination.
Example:example.com///Location-51/Department-18/Devices-3Src. VR Instance – The source IP address of a virtual router instance.
Dst. VR Instance – The destination IP address of a virtual router instance.
Source Info – Source Info is a compound string of multiple partial names/symbols and relates to the template:
Source Geo: An icon that is either
a flag symbol that relates to the state at the given geo-location
a symbol of a house that stands for a private IP address
EITHER:
Source IP: the source IP address that is associated with the geographical information (Geo-IP).
Example:
OR:
Named Network: If the IP address is defined by a named network, then the name of the Named Network is used.
Destination Info – Destination Info is a compound string of multiple partial names/symbols and relates to the template:
Destination Geo: An icon that is either
a flag symbol that relates to the state at the given geo-location
a symbol of a house that stands for a private IP address
EITHER:
Destination IP: the destination IP address that is associated with the geographical information (Geo-IP).
Example:
OR:
Named Network: If the IP address is defined by a named network, then the name of the Named Network is used.
Interface – The name of the interface is a compound of multiple partial names and relates to the template:
Output interface (see also Output-IF in this list)
"@"
(Optional): Name of the tunnel
Name of the box
"_"
(Optional): Name of the cluster
"_"
(Optional): Name of the range
Example: pvpn0@PGRP-MYBOX_Cluster2_1
Status – The status of the connection. For descriptions of the available status types, see the heading "Status Overview" below.
Src. Geo – The geographic source of the active connection.
Dst. Geo – The geographic destination of the active connection.
SD-WAN ID – The transport rating setting (Bulk, Quality, or Fallback with IDs 0-7). For more information, see SD-WAN below.
URL Category – Category of the destination URL.
Filter Options
You can filter the list of sessions by traffic type, status, and properties. Click the Filter icon on the top right of the ribbon bar to access the filtering options.
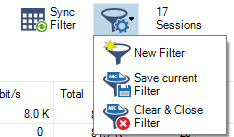
Click the Filter icon.
Select New Filter. The Traffic Selection section opens on the top left of the list.
Expand the Traffic Selection drop-down menu and select the required checkboxes:
Forward – Sessions that are handled by the Forwarding Firewall.
Loopback – System internal data exchanged by the loopback interface.
Local In – Incoming sessions that are handled by the box firewall.
Local Out – Outgoing sessions that are handled by the box firewall.
IPv4 – IPv4 traffic.
IPv6 – IPv6 traffic.
From the Status Selection list, you can select the following options to filter for certain traffic statuses:
Closing – Closing connections.
Established – Established connections.
Failing – Failed connections.
Pending – Connections that are currently being established.
You can set additional filters based on the content of the menu list when you click the '+' symbol in the blue ribbon bar. Although these filters are displayed together in a common menu list for selection, they belong to two groups of filters:
"Single filter" – A single filter relates directly to a single column name in the table view of the window, e.g., IP Protocol, Port, Source, Destination.
"Compound filter" – A compound filter relates to two columns of the table, e.g., Source/Destination, Any Interface, VR Instance (Src/Dst), that have a certain category in common, e.g., an IP address, a Named Network Object. You can regard such a filter as consisting of two separate filters (e.g., Source and Destination) that are linked to each other with a logical 'OR' operator and substituted by the filter (Source/Destination).

These additional filters can be used both on visible and blanked-out columns. As an example, you can activate a certain compound filter, e.g., Source/Destination, and the table view will display all matching records even if the column Destination is not visible.

Currently, there are the following compound filters you can select: Source/Destination, Any Interface, VR Instance (Src/Dst).
When you click the '+' icon in the blue ribbon bar, the menu list is created at runtime. The menu list first displays the filters that relate to the visible columns in the table view, followed by all remaining filters whose related columns are not visible. The following menu list is an example of the contained filters:
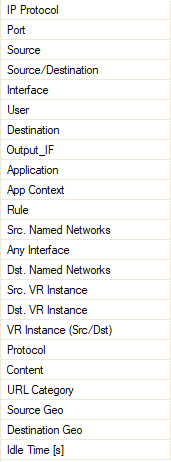
Select the requested filter category from the list.
Enter the exact value into the edit field of the filter criterion you want the data to match against, e.g., filter
Source, filter value10.17.84.65:

Some fields allow the use of wildcards (*?; !*?). Example: !Amazon* excludes all entries starting with Amazon; Y*|A* includes all entries starting with "Y" or "A". Clicking the Sync Filter icon on the top right of the ribbon bar above the filters allows you to switch to the History view but with the same filters applied.
Managing Sessions
You can view additional information for a specific session by double-clicking an entry.
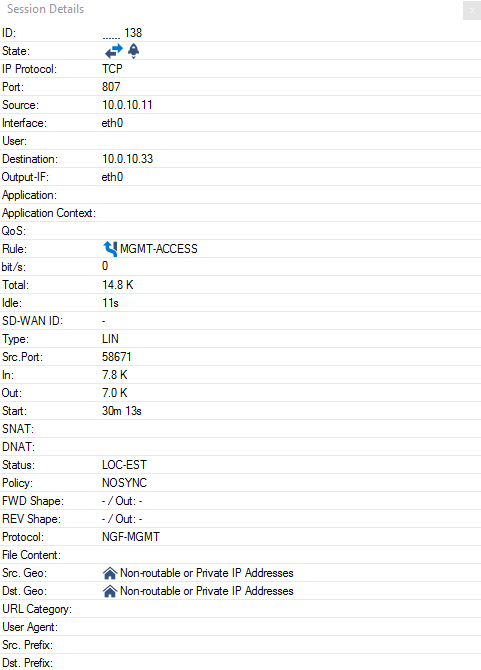
You can control, copy, print, export, and organize the sessions listed on the Firewall > Live page. When you right-click a session, you are provided with the following options:
Terminate Session – Ends the session.
Abort Session (No TCP RST) – Ends the session without a TCP request.
Change QoS / Reverse QoS – Let's you change the QoS band. For more information, see Traffic Shaping below.
Change SD-WAN Settings – Let's you change the SD-WAN settings. For more information, see SD-WAN below.
Show Session Details – Displays the session details.
For more settings, see: Barracuda Firewall Admin
Work Processes
In the lower left of the Live page, you can view and control firewall-related processes and workers. To access the status, click >> Show Proc on the lower left of the window.

The entry Active displays the currently active worker processes. The feature Kill Selected is used for terminating single workers.

The entry on the right of the Kill Selected button shows the status of the synchronization in case of active transparent failover. For more information, see High Availability.
The following possible states are available:
Active Sync (UP) – Shown on active HA partner; synchronization works.
Active Sync (DOWN) – Shown on active HA partner; sync would work, but box firewall is down.
Passive Sync (UP) – Shown on passive HA partner; synchronization works.
Passive Sync (DOWN) – Shown on passive HA partner; sync would work, but box firewall is down.
The window provides the following information about the processes:
PID – System process ID.
Connections – Number of connections handled by the worker process.
bps – Bytes per second (during the last second).
Heartbeat – Time in seconds the process stopped to answer. Should never be more than 2.
PID – System process ID. Allows viewing on PID and fully extended description column.
Description – Role description of the worker process.
Traffic Meter
A traffic meter is integrated on the lower right of the page. The firewall engine samples the amount of traffic over 10 seconds, and the traffic meter displays it based on the traffic origin (Forward, Loopback, Local, Total). Traffic can be displayed as Bits/sec, Bytes/sec, or Packets/sec.

The second available view is TF Sync (click the Traffic drop-down arrow) which contains detailed information concerning the Transparent Failover function of an HA Forwarding Firewall. The pull-down menu for the statistics type (with the options Bits/sec, Bytes/sec, and Packets/sec) has no function for this type of view. The display consists of the following entries:
My Sync Addr – IP address and connection port for synchronization of this box.
Partner Sync Addr – IP address and connection port for synchronization of the HA partner box.
Synced Sessions – Number of sessions successfully synchronized.
Pending Sessions – Number of pending sessions not synchronized.
Status Overview
This table provides descriptions of the possible statuses displayed in the Status column for each session on the Firewall > Live page:
Status Name | Origin | Description |
|---|---|---|
FWD-NEW | TCP Packet Forwarding Outbound | The session is validated by the firewall ruleset. Traffic has not been forwarded yet. |
FWD-FSYN-RCV | TCP Packet Forwarding Outbound | The initial SYN packet received from the session source was forwarded. |
FWD-RSYN-RSV | TCP Packet Forwarding Outbound | The session destination answered the SYN with a SYN/ACK packet. |
FWD-EST | TCP Packet Forwarding Outbound | The SYN/ACK packet was acknowledged by the session source. The TCP session is established. |
FWD-RET | TCP Packet Forwarding Outbound | Either source or destination is retransmitting packets. The connection might be dysfunctional. |
FWD-FFIN-RCV | TCP Packet Forwarding Outbound | The session source sent a FIN datagram to terminate the session. |
FWD-RLACK | TCP Packet Forwarding Outbound | The session destination answered the FIN packet with a FIN reply and awaits the last acknowledgment for this packet. |
FWD-RFIN-RCV | TCP Packet Forwarding Outbound | The session destination sent a FIN datagram to terminate the session. |
FWD-FLACK | TCP Packet Forwarding Outbound | The session source answered the FIN packet with a FIN reply and awaits the last acknowledgment for this packet. |
FWD-WAIT | TCP Packet Forwarding Outbound | The session was reset by one of the two participants by sending an RST packet. During a waiting period of five seconds, all packets belonging to the session will be discarded. |
FWD-TERM | TCP Packet Forwarding Outbound | The session is terminated and will be removed from the session list. |
IFWD-NEW | TCP Packet Forwarding Inbound | The session is validated by the firewall ruleset. Traffic has not been forwarded yet. |
IFWD-SYN-SND | TCP Packet Forwarding Inbound | A SYN packet was sent to the destination initiating the session. Note that the session with the source is already established. |
IFWD-EST | TCP Packet Forwarding Inbound | The destination replied to the SYN with a SYN/ACK. The session is established. |
IFWD-RET | TCP Packet Forwarding Inbound | Either source or destination is retransmitting packets. The connection might be dysfunctional. |
IFWD-FFIN-RCV | TCP Packet Forwarding Inbound | The session source sent a FIN datagram to terminate the session. |
IFWD-RLACK | TCP Packet Forwarding Inbound | The session destination answered the FIN packet with a FIN reply and awaits the last acknowledgment for this packet. |
IFWD-RFIN-RCV | TCP Packet Forwarding Inbound | The session destination sent a FIN datagram to terminate the session. |
IFWD-FLACK | TCP Packet Forwarding Inbound | The session source answered the FIN packet with a FIN reply and awaits the last acknowledgment for this packet. |
IFWD-WAIT | TCP Packet Forwarding Inbound | The session was reset by one of the two participants by sending an RST packet. During a waiting period of five seconds, all packets belonging to the session will be discarded. |
IFWD-LWAIT | TCP Packet Forwarding Inbound | An RST was received which sequence number is within the receive window but does not exactly match the next expected sequence number. |
IFWD-TERM | TCP Packet Forwarding Inbound | The session is terminated and will be removed from the session list. |
PXY-NEW | TCP Stream Forwarding Outbound | The session is validated by the firewall ruleset. Traffic has not been forwarded yet. |
PXY-CONN | TCP Stream Forwarding Outbound | A socket connection to the destination is being established. |
PXY-ACC | TCP Stream Forwarding Outbound | A socket connection to the source is being accepted. |
PXY-EST | TCP Stream Forwarding Outbound | Two established TCP socket connections to the source and destination exist. |
PXY-SRC-CLO | TCP Stream Forwarding Outbound | The socket to the source is closed or is in the closing process. |
PXY-DST-CLO | TCP Stream Forwarding Outbound | The socket to the destination is closed or is in the closing process. |
PXY-SD-CLO | TCP Stream Forwarding Outbound | The source and the destination socket are closed or in the closing process. |
PXY-TERM | TCP Stream Forwarding Outbound | The session is terminated and will be removed from the session list. |
IPXY-NEW | TCP Stream Forwarding Inbound | The session is validated by the firewall ruleset. Traffic has not been forwarded yet. |
IPXY-ACC | TCP Stream Forwarding Inbound | A socket connection to the source is being accepted. |
IPXY-CONN | TCP Stream Forwarding Inbound | A socket connection to the destination is being established. |
IPXY-EST | TCP Stream Forwarding Inbound | Two established TCP socket connections to the source and destination exist. |
IPXY-SRC-CLO | TCP Stream Forwarding Inbound | The socket to the source is closed or is in the closing process. |
IPXY-DST-CLO | TCP Stream Forwarding Inbound | The socket to the destination is closed or is in the closing process. |
IPXY-SD-CLO | TCP Stream Forwarding Inbound | The source and the destination socket are closed or in the closing process |
IPXY-TERM | TCP Stream Forwarding Inbound | The session is terminated and will be removed from the session list. |
UDP-NEW | UDP Forwarding | The session is validated by the firewall ruleset. Traffic has not been forwarded yet. |
UDP-RECV | UDP Forwarding | Traffic has been received from the source and was forwarded to the destination. |
UDP-REPL | UDP Forwarding | The destination replied to the traffic sent by the source. |
UDP-SENT | UDP Forwarding | The source transmitted more traffic after receiving a reply from the destination. |
UDP-FAIL | UDP Forwarding | The destination or a network component on the path to the destination sent an ICMP indicating that the request cannot be fulfilled. |
ECHO-NEW | ECHO Forwarding | The session is validated by the firewall ruleset. Traffic has not been forwarded yet. |
ECHO-RECV | ECHO Forwarding | Traffic has been received from the source and forwarded to the destination. |
ECHO-REPL | ECHO Forwarding | The destination replied to the traffic sent by the source. |
ECHO-SENT | ECHO Forwarding | The source sent more traffic after receiving a reply from the destination. |
ECHO-FAIL | ECHO Forwarding | The destination or a network component on the path to the destination sent an ICMP indicating that the request cannot be fulfilled. |
OTHER-NEW | OTHER Protocols Forwarding | The session is validated by the firewall ruleset. Traffic has not been forwarded yet. |
OTHER-RECV | OTHER Protocols Forwarding | Traffic has been received from the source and forwarded to the destination. |
OTHER-REPL | OTHER Protocols Forwarding | The destination replied to the traffic sent by the source. |
OTHER-SENT | OTHER Protocols Forwarding | The source sent more traffic after receiving a reply from the destination. |
OTHER-FAIL | OTHER Protocols Forwarding | The destination or a network component on the path to the destination sent an ICMP indicating that the request cannot be fulfilled. |
LOC-NEW | Local TCP Traffic | A local TCP session was granted by the local ruleset. |
LOC-EST | Local TCP Traffic | The local TCP session is fully established. |
LOC-SYN-SND | Local TCP Traffic | A Local-Out TCP session is initiated by sending a SYN packet. |
LOC-SYN-RCV | Local TCP Traffic | A Local-In TCP session is initiated by receiving a SYN packet. |
LOC-FIN-WAIT1 | Local TCP Traffic | An established local TCP session started the closing process by sending a FIN packet. |
LOC-FIN-WAIT2 | Local TCP Traffic | A local TCP session in the FIN-WAIT1 state received an ACK for the FIN packet. |
LOC-TIME-WAIT | Local TCP Traffic | A local TCP session in the FIN-WAIT1 or in the FIN-WAIT2 state received a FIN packet. |
LOC-CLOSE | Local TCP Traffic | An established local TCP session is closed. |
LOC-CLOSE-WAIT | Local TCP Traffic | An established local TCP session received a FIN packet. |
LOC-LAST-ACK | Local TCP Traffic | Application holding an established TCP socket responded to a received FIN by closing the socket. A FIN is sent in return. |
LOC-LISTEN | Local TCP Traffic | A local socket awaits connection requests (SYN packets). |
LOC-CLOSING | Local TCP Traffic | A local socket in the FIN_WAIT1 state received a FIN packet. |
LOC-FINISH | Local TCP Traffic | A local TCP socket was removed from the internal socket list. |
Policy Overview
This table provides descriptions of the possible policies that you might see in the Policy column for each session on the Firewall > Live page:
Policy | Description |
|---|---|
NO_MATCH_IIF | The received packet (Forward Direction) must NOT match the initial input interface. |
NO_MATCH_OIF | The received packet (Reverse Direction) must NOT match the initial output interface. |
INBOUND | The Inbound Accept Policy is used. |
FWD_FILTER | The content filter is applied for forwarding traffic. |
REV_FILTER | The content filter is applied for reverse traffic. |
TRACE | The session is traced. |
NOTIFY_CONNECT | The Firewall Service is notified about successful or failing TCP establishment. These notifications are required for multiple redirection statuses. |
Source-Based NAT | The bind IP address is determined by the routing table. |
NOLOG | Log file entries are not generated by the session. |
NOSTAT | Statistics are not generated by the session. |
NOCACHE | An access cache entry is not generated by the session. |
NONAGLE | The Nagle algorithm is turned OFF. |
LOG_STATE | Every state change of this session is logged. |
OWN_LOG | The session will log to the firewall rule log file. |
SRVSTAT | The session resolves service object names when generating statistics. |
DYNAMIC_PORT | The session is dynamically NAT'd. The outgoing source port will differ from the original client port. |
NOSYNC | The session is not synchronized for transparent failover. |
CLEAR_ECN | The session clears any ECN bits in the IP header. |
