

New Homepage
The new homepage provides improved situation awareness. Many of the following features are supported when All is selected in the Account dropdown and will be particularly useful for users who manage more than one account.
The homepage introduces many new features, including:
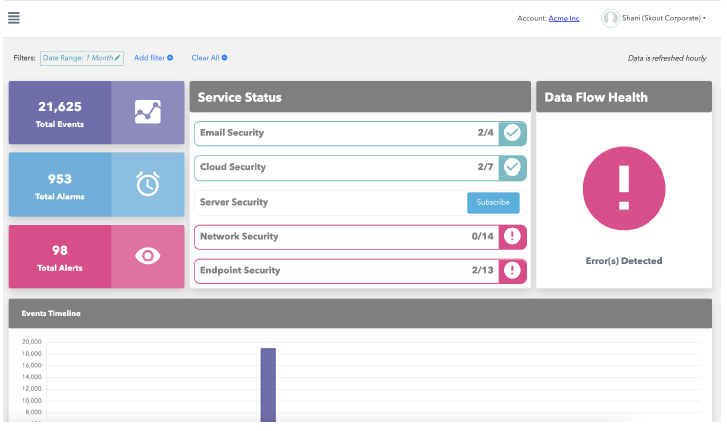
- Realigned what Alarms and Alerts are and changed how Alarms are counted. An Alarm is a pattern of activity that implies a potential risk. This activity could indicate an identified threat to an information system, violate acceptable use policies, or the circumvention of standard security practices. An Alert is any Alarm escalated to a customer/MSP. Hover over Alerts to see how many are currently open.
- Also introduced a new statistic, called Events. An Event is a single, observable item in a monitored data source, e.g., a packet or token, aka the "raw data". The number of Events that XDR has analyzed demonstrates the amount of "work" needed to perform SOC duties and the value these services bring to XDR customers.
- Events, Alarms, and Alerts statistics are available when All is selected in the Account dropdown.
- Service status visualizes the different XDR products and what Integrations are available. Service Status communicates where XDR could provide more security coverage to the customer. Each service displays how many things you can monitor and how many you are monitoring.
- There are two reasons a Service Status will get into an error state: A data flow issue, which will also show in the Data Flow Health area. This reflects data that was flowing into the XDR platform is now experiencing some sort of outage. Or no Integrations have been configured for a licensed product. This reflects an onboarding state for the respective product and will shows the customer if they need to perform actions to get the data configured.
- Data Flow Health communicates whether there are issues with the configured Integrations. At any given point, the integrations being monitored by XDR could experience some sort of outage. This area is used to quickly communicate issues with a configured Integration. The Data Sources table below then shows which of the Integrations has the issue or validates that everything is flowing correctly. Data Flow Health is available when All is selected in the Account dropdown.
- Events Timeline visualizes all of the raw data being analyzed by XDR. Spikes in Events could indicate blocked brute-force attacks and other malicious activities. Events Timeline is available when All is selected in the Account dropdown.
- Data Sources table - Each row in the table represents an asset being monitored by XDR (e.g. a firewall, AWS CloudTrail, a Windows server, etc.) and helps customers manage that Integration. This table allows customers to readily see what assets are being monitored by XDR, including the total count of assets and relevant information about that Data Source. If the Data Flow Health on the top of the homepage is in an error or warning state, there will be one-to-many Data Sources listed in this table with either an error or warning. This gives customers the ability to readily identify what data may be experiencing outages. Log Degradation, which is enabled by default, creates Alerts if a Data Source is experiencing any type of loss or outage, can now be configured by clicking on the respective asset in this table. Once enabled, the outputted Alerts can be "snoozed" for either 1 day or 1 week to allow for legitimate maintenance activities on that asset. When the selected time passes, the Log Degradation Alert will be automatically reenabled. Customers can also disable this Alert altogether. The Data Sources table is available when All is selected in the Account dropdown.
Integration Enhancement
As an open-XDR platform, we are constantly expanding the data we can monitor to ensure we are meeting our customer's needs. As a result, we are excited to announce our newest Integrations, which are actively in beta:
- Mimecast
- Bitdefender
Updated Terms and Conditions
End-customer Terms & Conditions are executed for all new accounts, ensuring that Barracuda's responsibility is clearly communicated.
Enhancements to the Managed Endpoint Security service
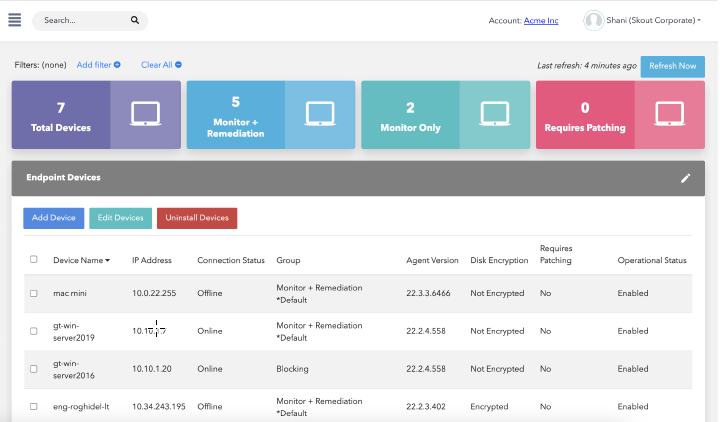
Enhancements to the Managed Endpoint Security service includes:
- Exposing endpoint intel such as requires patching (OS- and application-level patches), has disk encryption, and more.
- Updated policy naming convention for all new customers to make it more user friendly.
Updates to the Setup > Integrations page
Updates include:
- New descriptions for each integration.
- Badges to visualize if the connection will use APIs, Syslog, or both.
- Show Barracuda IDS and Inky as available Integrations. That way, the number of Integrations found on the new homepage's Service Status now matches what is listed on this page when sorted by Product.
- UX enhancements.
Integration with Microsoft Azure
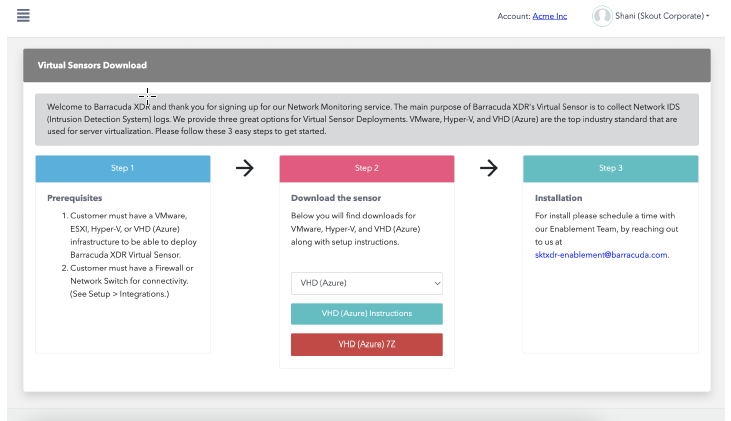
You can now integrate Microsoft Azure using the XDR Virtual Sensor.
Also
- Various backend enhancements for upcoming releases.
- Various bug fixes, including Threat Advisories being shown in the Dashboard.