

The Endpoint Security page displays a list of events, sorted in reverse chronological order by default. The events displayed are affected by the filters chosen, whether you choose to filter by date range, device IP, keyword, OS, OS type, threat status, threat type, or any other filter. For more information on filtering, see Filtering the Endpoint Security Page.
For each event, this list contains the date and time the ticket was created, the IP of the origin, the type of the event, and the event's status. You can also click any event to see any additional information that was included in the event.
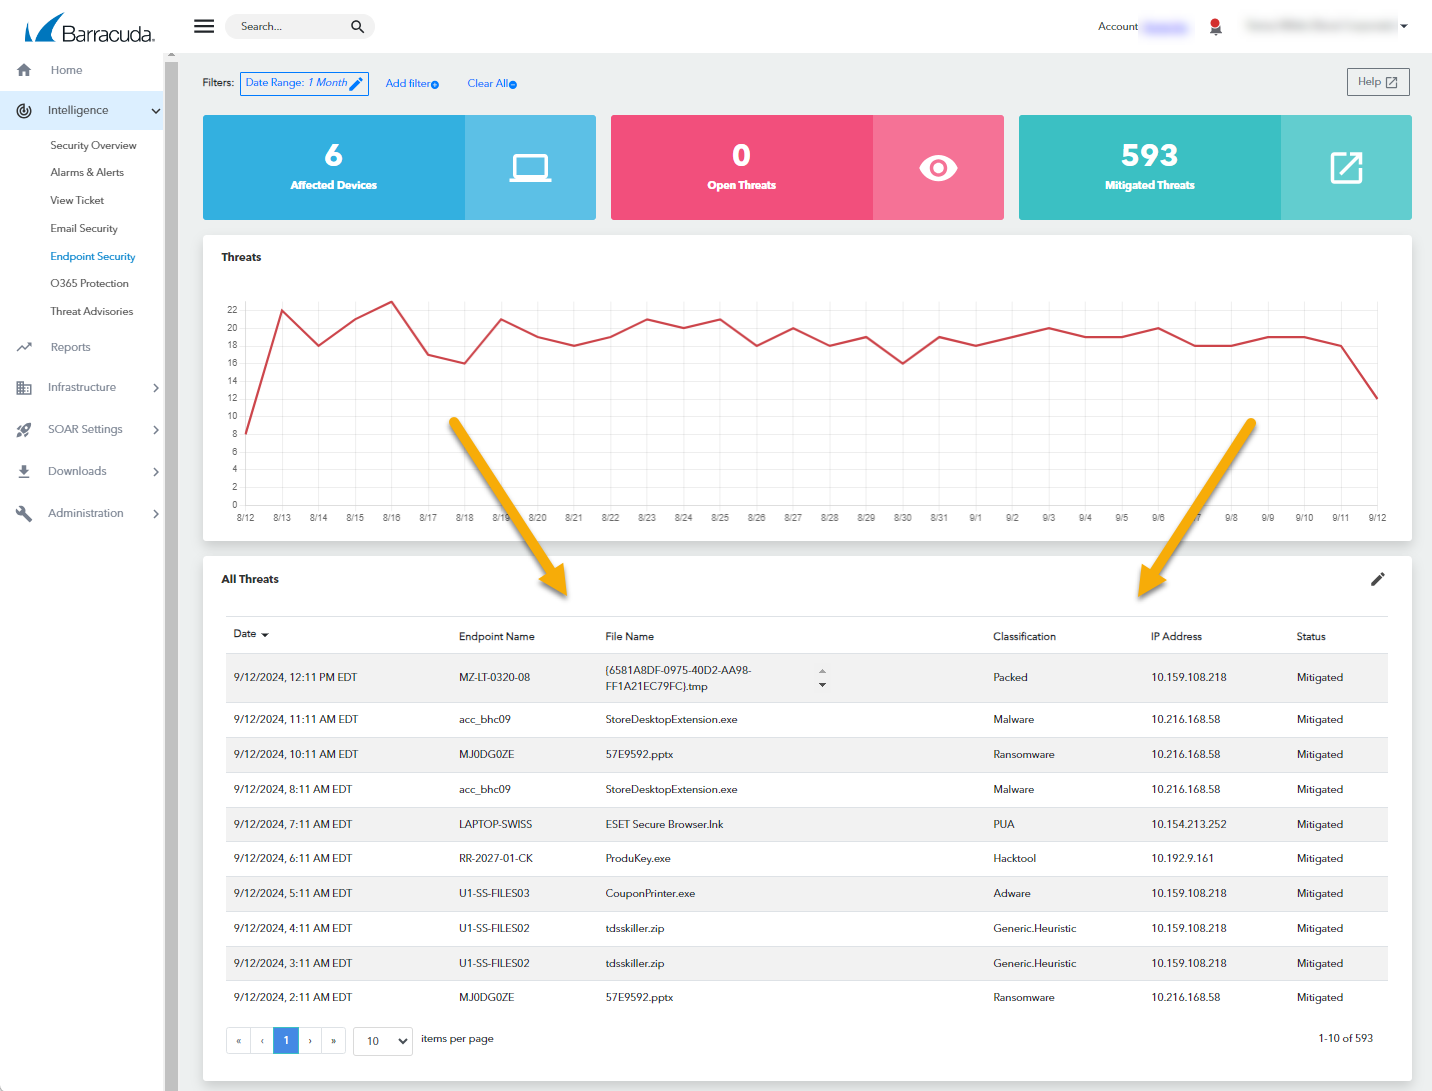
To view events on the Endpoint Security page
In Barracuda XDR Dashboard, click Intelligence > Endpoint Security.
Scroll down to the All Events section.
To view the details of an event
In Barracuda XDR Dashboard, click Intelligence > Endpoint Security.
Scroll down to the All Events section.
Click an event you want to see more information on.