Barracuda WAF-as-a-Service includes Firewall Logs, Access, and Event Logs.
Firewall Logs are generated whenever suspicious HTTP requests are detected and denied, based on access control lists.
Access Logs are generated for all user requests, providing information about website traffic and performance.
Event Logs are generated for specific network activity, including events related to Certificate, DDoS, or DNS.
For information on Audit Logs, refer to Audit Logs.
For information on Event Log Messages, refer to Event Log Messages.
For information on Log Retention and Location, refer to Log Retention and Location.
To view logs for an application:
In the Barracuda WAF-as-a-Service web interface, click Applications in the left panel.
On the Applications page, select an application.
In the left navigation, select Logs.
On the Logs page:
Click Filter to open the filtering panel.
Configure the following filter criteria:
Field: Select Log type.
Condition: Select In.
Value: Choose one or more from Access, Firewall, or Event.
The system will apply the selected filter and display only the matching logs on the screen.
For details on a specific log entry, click the plus icon for the record. The row will expand to display event-specific details.
Focusing Log Results
You can build filters to focus on specific log data, including Query Strings, URLs, and Methods.
Steps to create a filter
Click the Filter button to bring up the filter builder model.
You can ignore the Filter name field unless you plan on saving the filter you create.
Use the Field, Condition, and Value fields to create a filtering expression. The Field and Condition fields are dropdown lists you can select from. The Value field can either be a drop-down list or fill in depending on your other selections. As you complete each expression, the logs will automatically update to reflect the search criteria you entered. Also, the expression and any others you create will appear as filter chips above the logs.
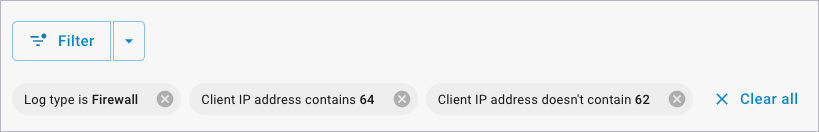
Expressions can be removed by clicking the garbage can icon or clicking the X on the filter chip.
Some expressions come with the option to add an "Or" scenario. Example: if you select Server port in the Field dropdown list, the word "Or" and a plus sign
appear. Click the plus sign to extend the expression. Each portion of the expression will appear as a separate filter chip.
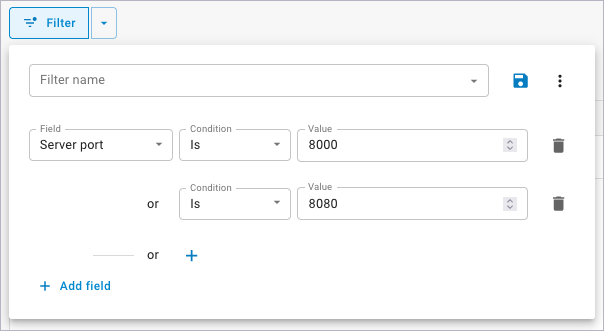
Click Add field to add additional filter criteria.
When viewing the details of a log item, many of the fields can be added to the existing filter by clicking the plus icon. This additional filtering will occur immediately and a filter chip will be added above the logs.
Specifying a Date Range
To filter by specific dates, click the date/time filter. There, you can:
Choose a pre-defined Quick Range value, like the last 7 or 30 days. The last Quick Range value matches the maximum retention period for the logs, and this is dependent on the license plan.
Define a custom date and time range up to the maximum retention period of the logs.
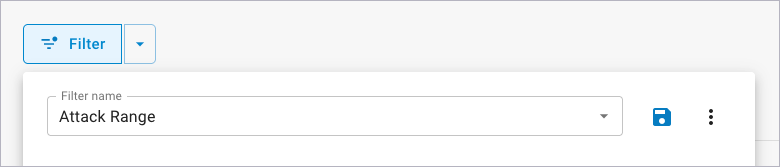
Saved Filters
Save a filter
Click the Filter button.
Enter a Filter name.
Configure as many filter expressions as you like.
Click the Save icon to the right of the Filter name field.
Using a saved filter
You can find the saved filters by clicking the down arrow ![]() next to the Filter button, or by clicking the Filter button and selecting from the Filter name dropdown list. The filter expressions will display for any saved filter you select.
next to the Filter button, or by clicking the Filter button and selecting from the Filter name dropdown list. The filter expressions will display for any saved filter you select.
Edit a saved filter
Click the down arrow next to the Filter button and select the saved filter you want to edit.
Click the Filter button to see the parameters configured for this filter.
Add, delete or change any desired parameters.
Click the Save icon to the right of the Filter name field.
Delete a saved filter
Click the down arrow next to the Filter button and select the saved filter you want to delete.
Click the Filter button to see the parameters configured for this filter.
Click the three dots to the right of the Filter name field.
Select Delete.
Confirm that you would like to delete the filter.
Resetting Filters
There are three ways to reset or reduce the amount of filtering.
Click the X on one or more of the filter chips. The page will automatically update and show results that include only the remaining filter parameters.
Click the Clear all link to the right of the filter chips. All filtering will be removed and the results will automatically update.
Click the Filter button and add or remove parameters from currently displayed results. The results automatically update.
Downloading Log Data
When you have focused your log results, click Download. A CSV file of your results downloads automatically.
Note that there is a limit to the number of rows you can download. Only the first 10,000 rows of data can be exported to a CSV file. If your table displays more than 10,000 rows, a warning displays, instructing you to use more restrictive filters to view a smaller set of data, so you can download all of the log rows.
Converting Timestamps to a Readable Time and Date Format
The exported CSV file will have the Date column in a timestamp format, meaning each date will show up as the number of milliseconds since January 1, 1970 (epoch timestamp x 1000). Most spreadsheet applications will have a way to convert to something more easily readable. The following steps apply to most Microsoft Excel versions:
Open the downloaded CSV file in Excel.
Right-click at the top of the column to the right of the Date column. Example: For the Access Logs, column B contains the time and date, so you would right-click at the top of column C.
Select Insert in the menu that opens. This creates a new, empty C column.
In the second field of column C (row 2), enter this formula:
=((B2/1000)/86400)+25569and copy down by clicking and dragging from the bottom-right corner of this field.For an understanding of this formula, see https://www.epochconverter.com. Note that we divide by 1000 because our timestamps are in milliseconds.
Right-click at the top of column C and select Format cells.
Choose your desired format. Example:
3/14/22 1:30 PM. All data in this column will then match this format.
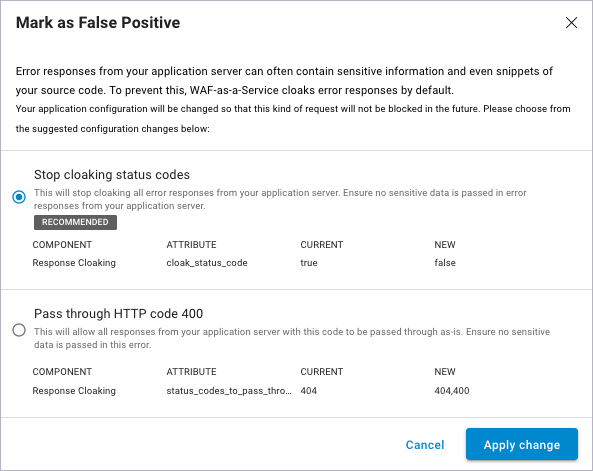
Marking as False Positive
When you review Firewall Logs, you might encounter a log entry that is a false positive: that is, where Barracuda WAF-as-a-Service detected a request as an attack, but the request was legitimate. Most often, this happens because a default limit on Barracuda WAF-as-a-Service is too restrictive.
To allow the legitimate request through, you must loosen security rules. It is advisable to loosen only the rules required, only for that particular page and/or parameter, and only by the minimum amount necessary to allow the legitimate request through. In many instances, Barracuda WAF-as-a-Service can do this automatically for you.
To loosen a restriction:
In the Firewall Log, locate the entry that is a false positive.
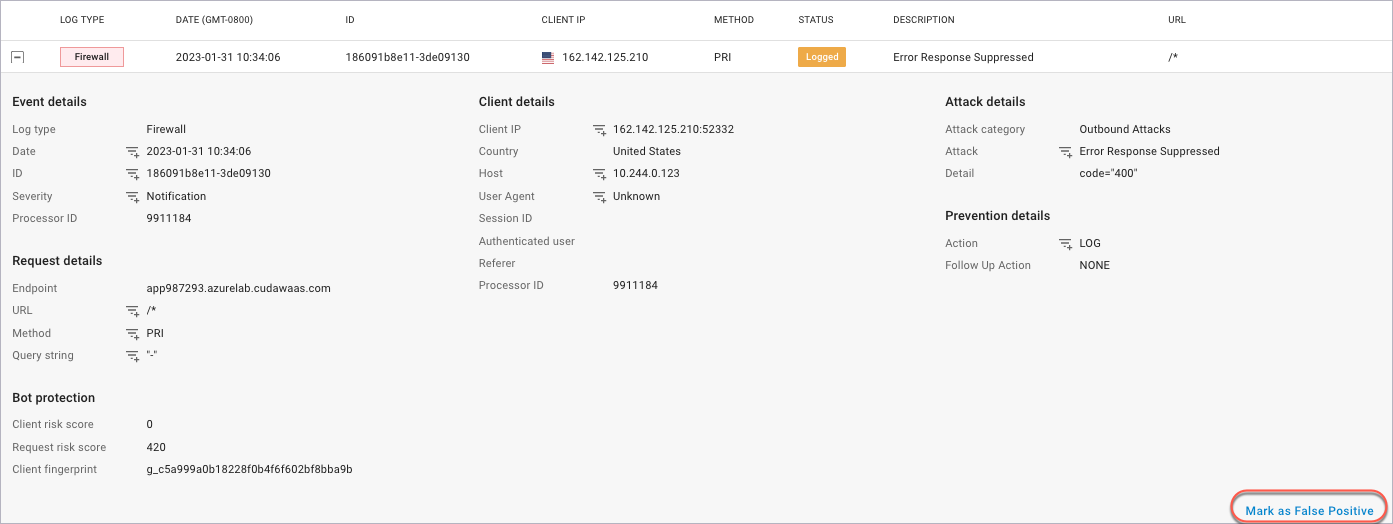
Click Mark as False Positive, in the lower right corner of the screen.
Barracuda WAF-as-a-Service will suggest one or more configuration changes that will allow this request through. If more than one option is shown, you will typically choose the one that Barracuda WAF-as-a-Service displays as Recommended; however, review all the options and choose the one that is most appropriate for your application.Click Apply Change.