After you configure Barracuda WAF-as-a-Service, the Dashboard shows you information for each of your applications.
The customizable Dashboard is the home page for each of your applications, displaying information for a time frame you select.
To display the Dashboard, navigate to the Applications page, then select the application you want to explore.
You can choose to display a wide variety of charts and graphs, select the date range for the data, and even select how you want to lay out the components.
Configuring the Dashboard
Settings are independent and specific for each application. Changing the settings for one application does not change the settings for other applications. You can change each Dashboard configuration at any time.
Adding Charts
To add a chart:
- In the Dashboard, click Add Charts.
- Click one or more charts to add the selected chart to the Dashboard for that application. You can return to this list at any time. Only charts that are not already on your Dashboard – including newly released charts – are presented in this list.
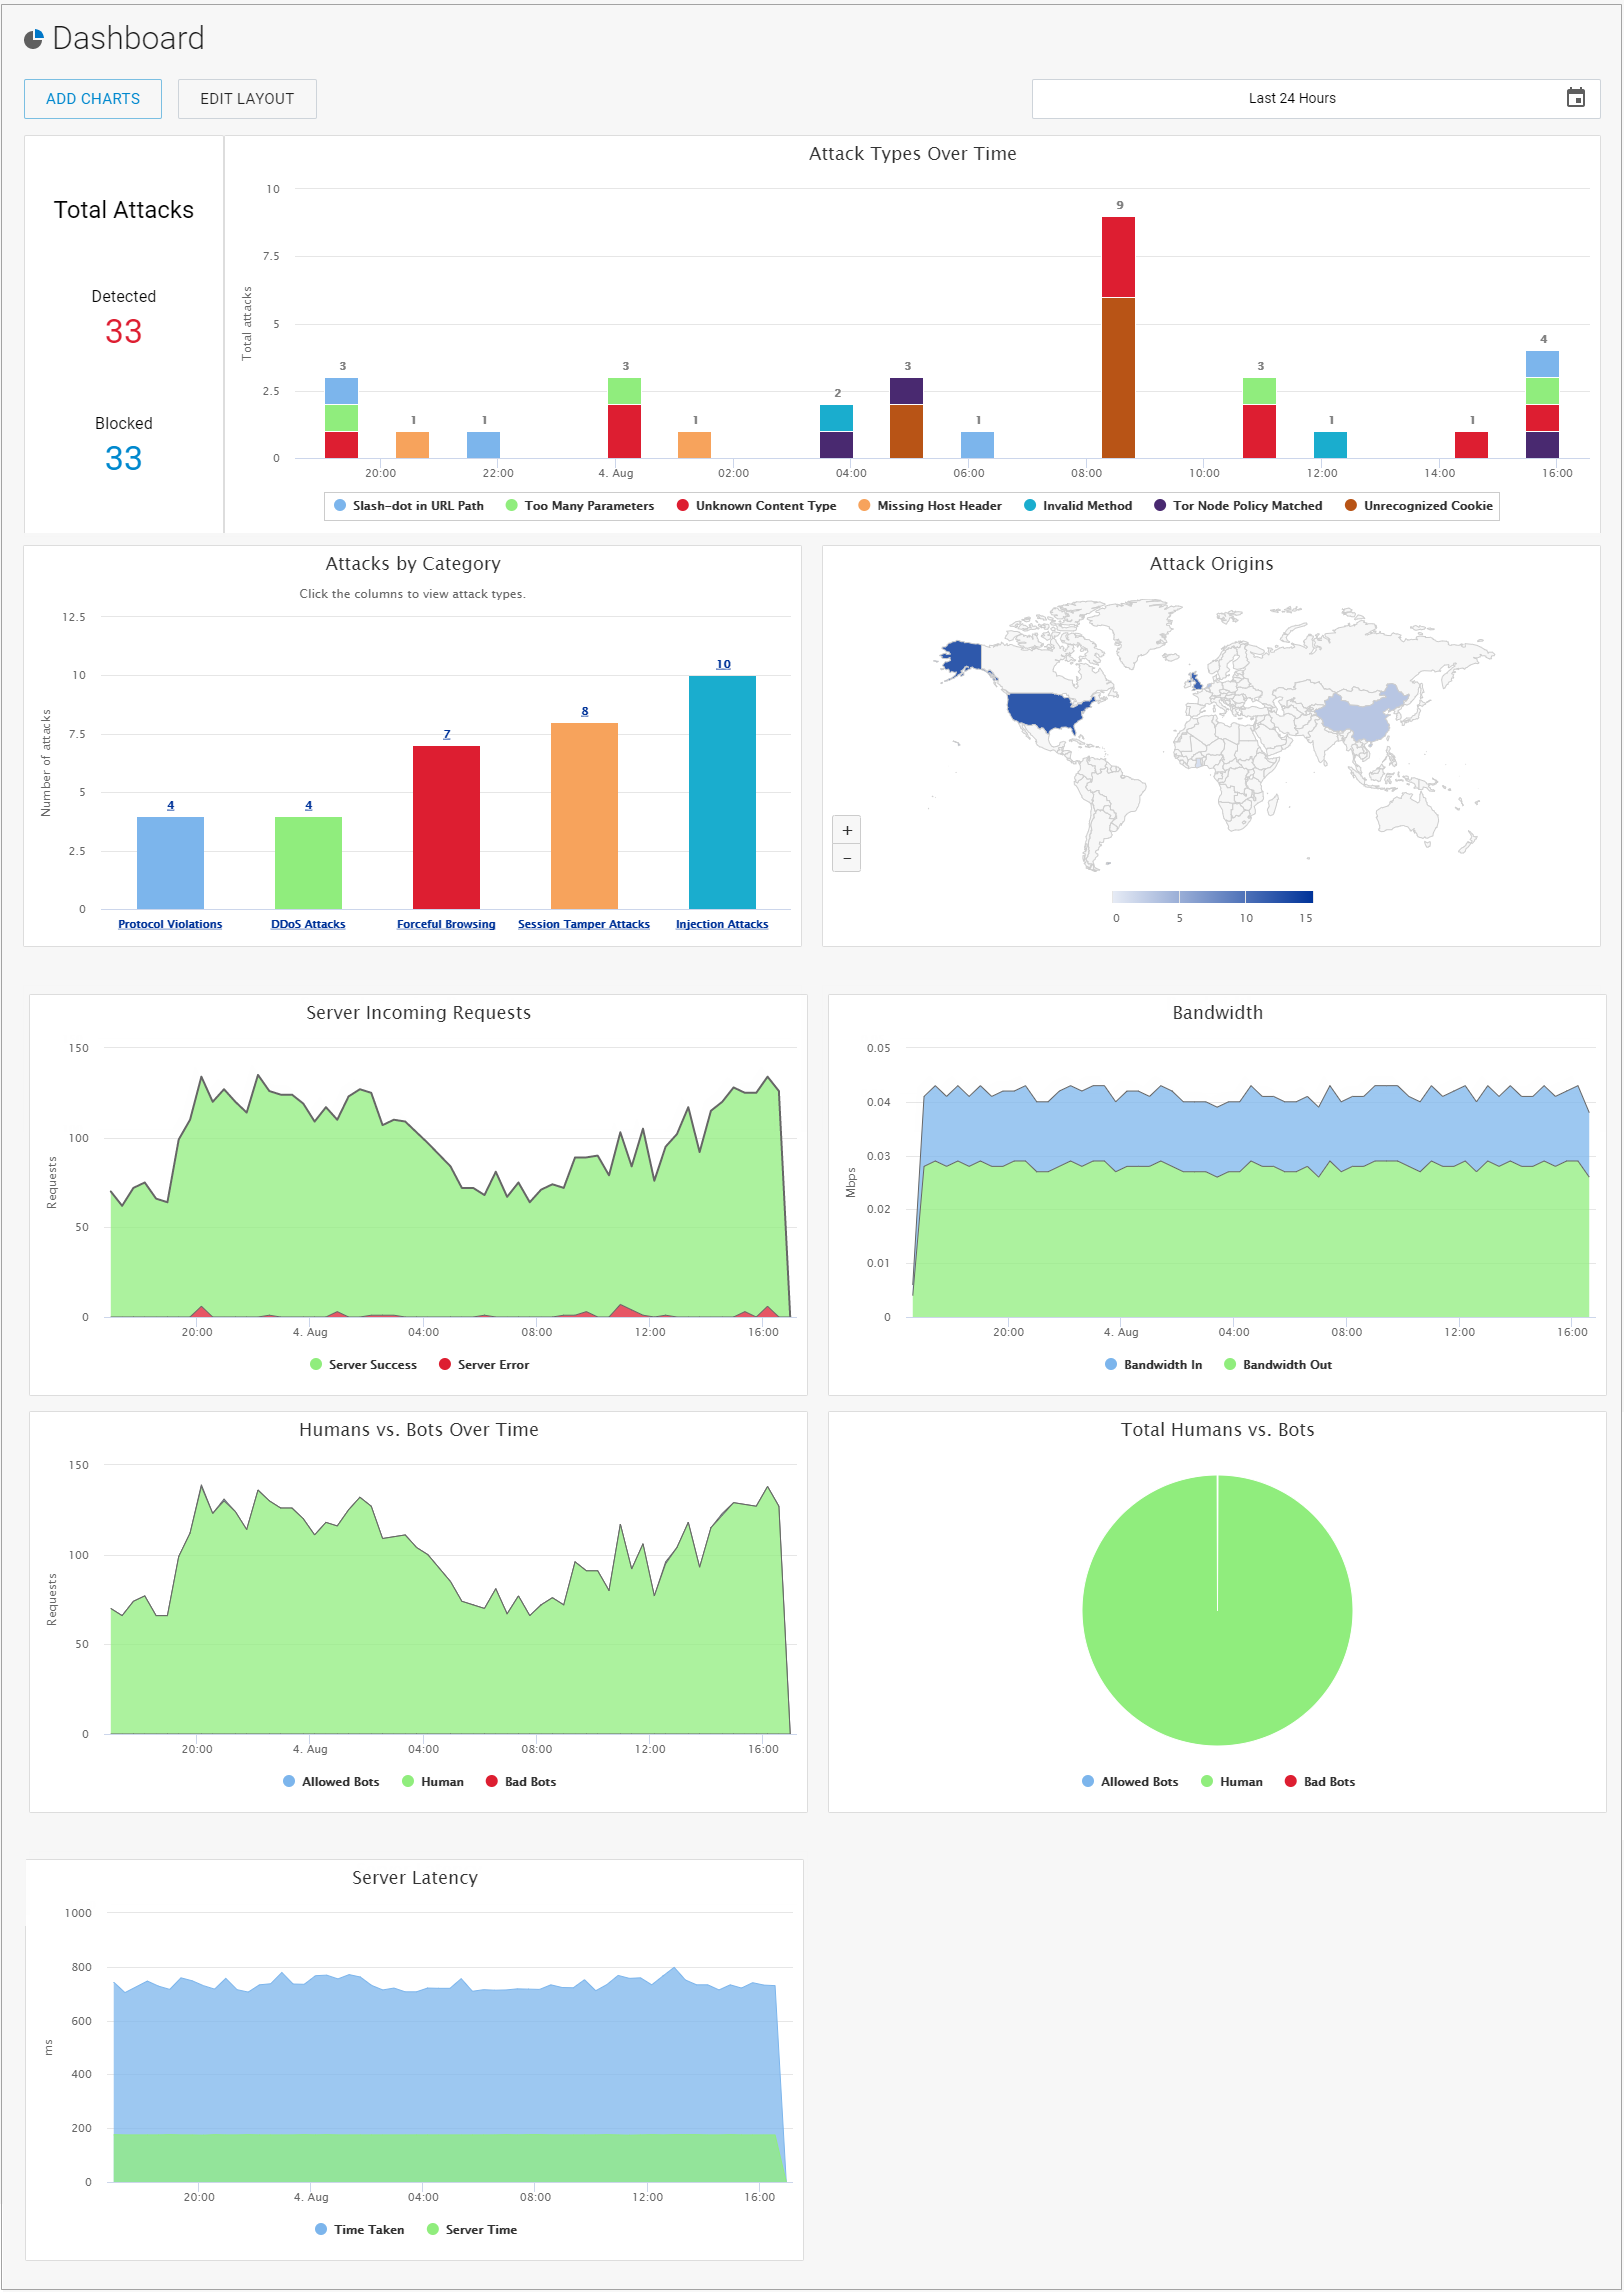
Charts include:- Attacks Over Time, includes Total Attacks
- Attacks by Category
- Attack Origins
- Bandwidth
- Humans vs Bots Over Time
- Total Humans vs Bots
- Server Incoming Requests
- Server Latency
- WAF Incoming Requests
Editing the Layout
To edit the layout:
- Click Edit Layout. Notice each chart has a dotted line around it and an X in the upper right corner.
- Take one or more of the following actions:
- Remove a chart by clicking the X in its upper right corner.
- Rearrange charts on the page by clicking a chart and dragging it to another location. If there is another chart in that new location, it will take the place of the chart you are moving.
- When you are satisfied with your layout, click Finish Editing. You can edit the layout at any time.
Specifying the Time Frame
The default time frame for the charts on the Dashboard is the Last 24 hours.
To change the time frame:
- Click Last 24 Hours (or current time frame value) or the calendar icon.
- Select a Quick Range, like Last 7 Days or Last Hour. Alternatively, specify the range of data you want to use for the report. Optionally click the time for the start and/or end to change the time zone.
- Click Apply.