Barracuda WAF-as-a-Service offers cloud-based protection for you and your users. As shown in the traffic flow diagram, you can see that Barracuda WAF-as-a-Service works between you and your users.
Design Concepts and Goals
Barracuda WAF-as-a-Service was designed with the following concepts in mind to make it reliable and performant:
- Data Path – The part of Barracuda WAF-as-a-Service that processes real-time application traffic. In this path, performance is critical.
- Resilient – Aiming for minimal to no down time for your application. Target of 100% availability.
- Scalable – Need to be able to handle application sizes ranging from very small (less than 1Mbps) to very large (greater than 1Gbps)
- Fast – Aiming to minimize wait time for you and your application users. Target of 1 ms latency for security,
- Distributed – Located worldwide to be near you and your backend application servers to reduce network latency. Target of less than 10 ms network latency.
- Management Path – The part of Barracuda WAF-as-a-Service that propagates your configuration into the infrastructure.
- Resilient – Regardless of configuration failures, rollbacks, communication issues, the configuration must reach the data path.
- Fast – Must be fast to enable you to make and test configuration changes easily. This speed does not need to be as fast as the speed needed for the Data Path.
Data Path Infrastructure
This section describes the basic units of the infrastructure and how they fit together to form larger units.
Containers
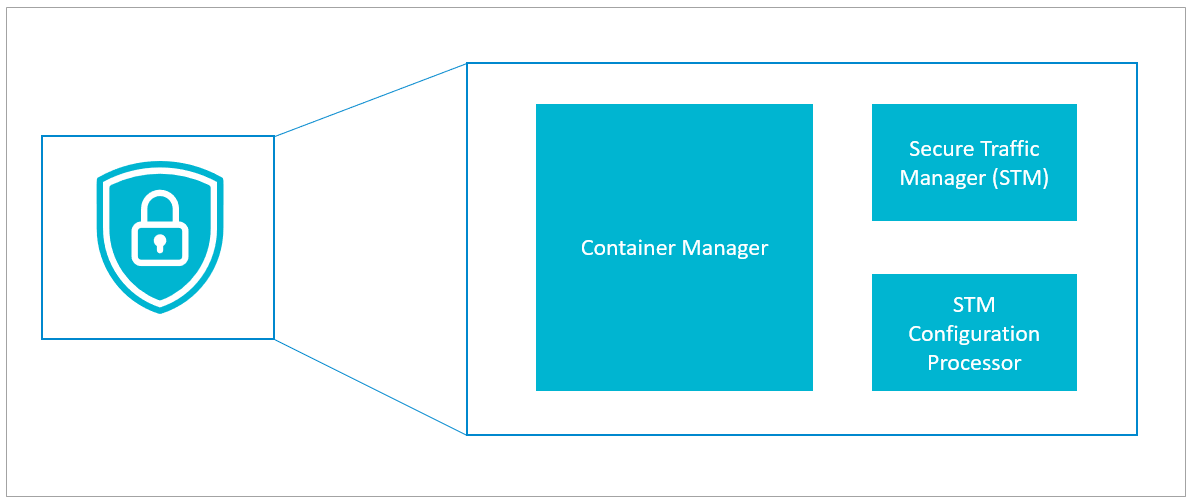
The basic unit of infrastructure, containers house the main security engine of Barracuda WAF-as-a-Service. Containers are separate and distinct from one another. Within Barracuda WAF-as-a-Service each container serves one organization.* In this way, problems cannot spread and there is no mixing of data between organizations.
* Due to redundancy, each organization is served by multiple containers.
Each container includes one of each of the following:
- Secure Traffic Manager (STM) – Barracuda Networks' highly optimized security engine secures your applications
- STM Configuration Processor – Passes your configuration through to the STM
- Container Manager – Imports your configuration, exports logs, and generally manages the container
Clusters
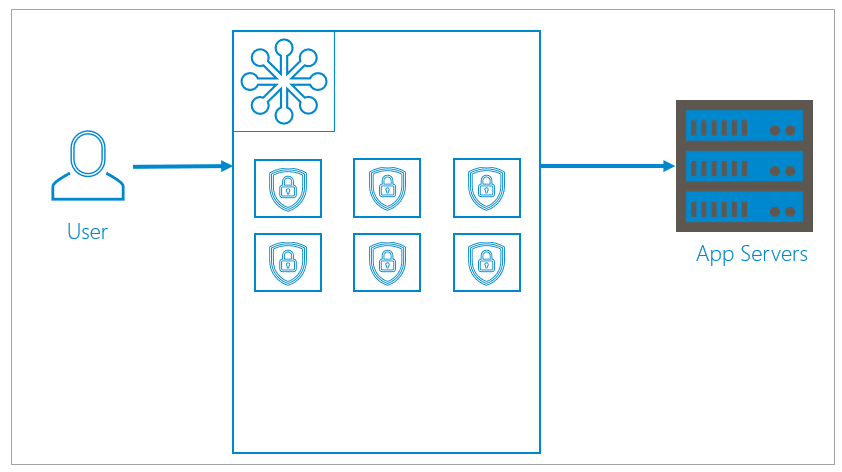
A cluster is a group, or array, of multiple containers serving multiple organizations. Clusters can dynamically and infinitely scale up or down, depending on your needs.
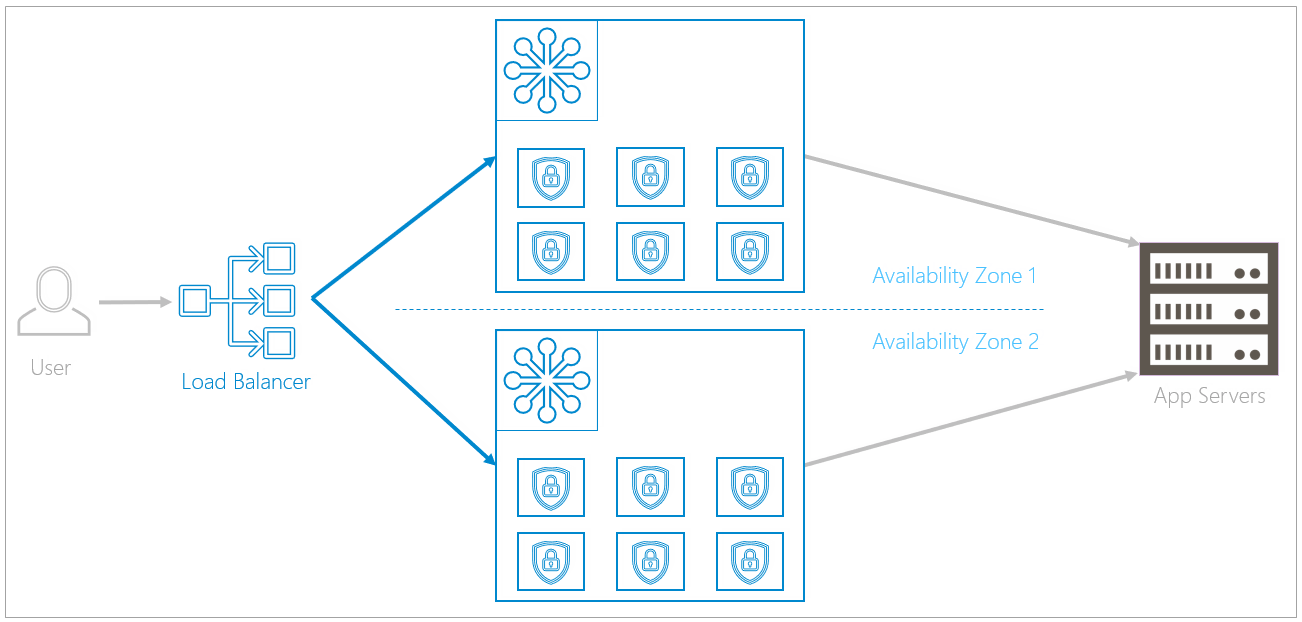
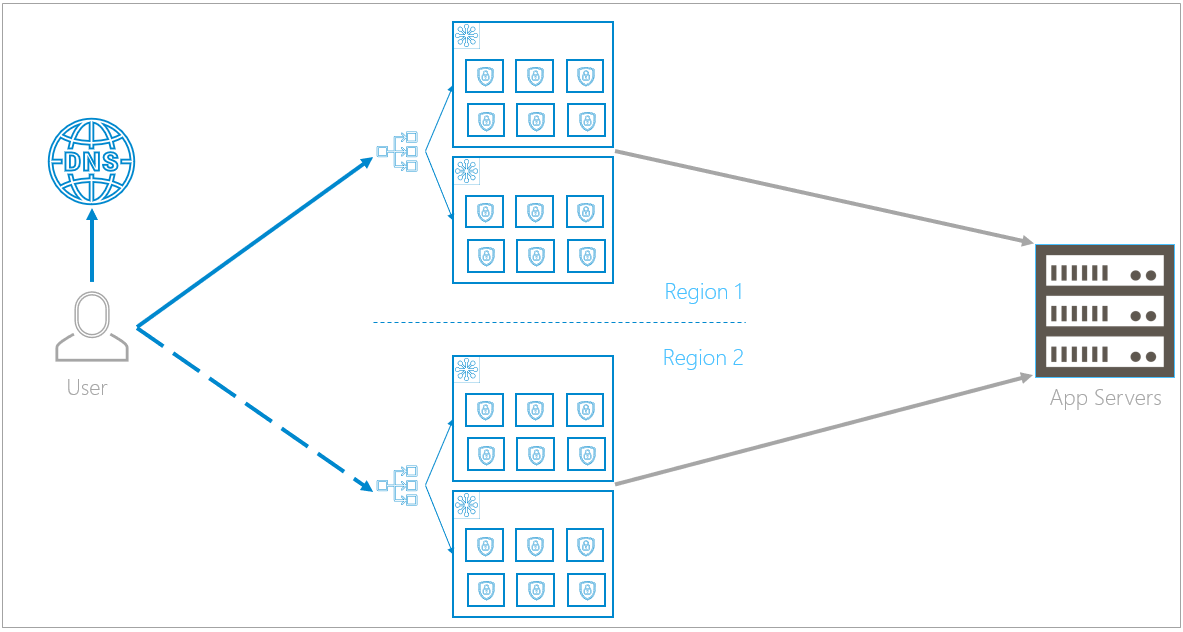
Regional: Duplicate Clusters within Availability Zones
Clusters are duplicated within two separate availability zones. Availability zones, a feature of the public cloud, are logical data centers located within a city or metropolitan area, but are housed in separate buildings with separate electricity and climate control. If one availability zone has a problem, like losing electricity, redundant clusters in other availability zones are unlikely to be affected.
A load balancer in front of the availability zones directs traffic equally to both availability zones. If an issue occurs, like the rollout of an update or a local natural disaster, the load balancer can redirect traffic to the availability zone that is still up and running. The Data Path Failure Scenarios section describes failover in more depth.
Global: Duplication between Regions
Availability zone infrastructure is duplicated in two separate regions, so localized problems will not affect the redundant infrastructure. Regions are close together geographically, to avoid latency issues, but are not so close that both regions will be affected by a localized catastrophe. For example, different regions might be in California and the state of Washington. An earthquake in California would be unlikely to affect Washington.
Unlike load balancing in availability zones, here, DNS is used for load balancing between regions. Under normal circumstances, DNS routes all traffic only to the primary region. The primary region is usually located closest to the back-end servers, so this choice minimizes latency. If a problem arises, DNS sends the traffic only to the unaffected region. Since the backup region is geographically close, there is a minimal difference in latency when the traffic flow shifts. The Data Path Failure Scenarios section describes failover in more depth.
Data Path Failure Scenarios
This section describes failure scenarios, from simple to more complex. Regardless of the type of failure, there is no downtime for you or your users.
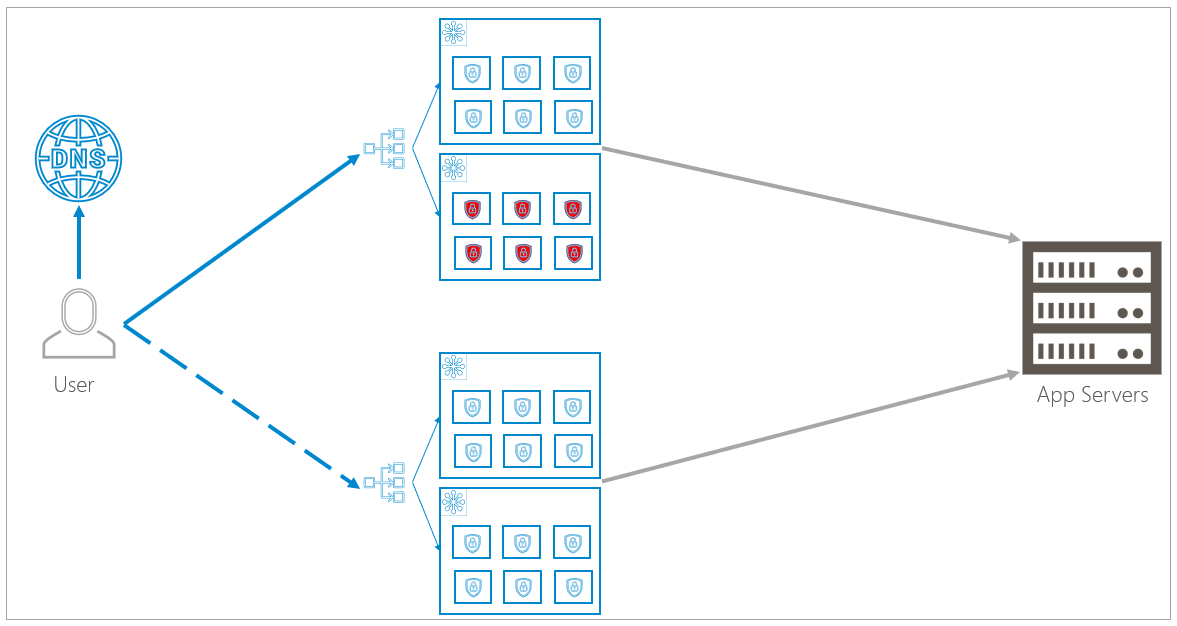
Availability Zone Failure
An availability zone failure affects all of the containers within it.
If the infrastructure detects that one availability zone is down, within a few seconds, it redirects traffic to the redundant availability zone in the same region. The cluster in the remaining availability zone will scale up to meet the increased demands caused by the nonfunctioning availability zone.
Region Failure
The DNS load balancing detects that a region is no longer online and routes all traffic to the backup region. As described above, under normal circumstances all traffic flows to the primary region. Now, under failure conditions, all traffic is routed to the secondary region. As soon as the primary region becomes active again, the DNS load balancer again routes traffic to the primary region.
Rolling Updates
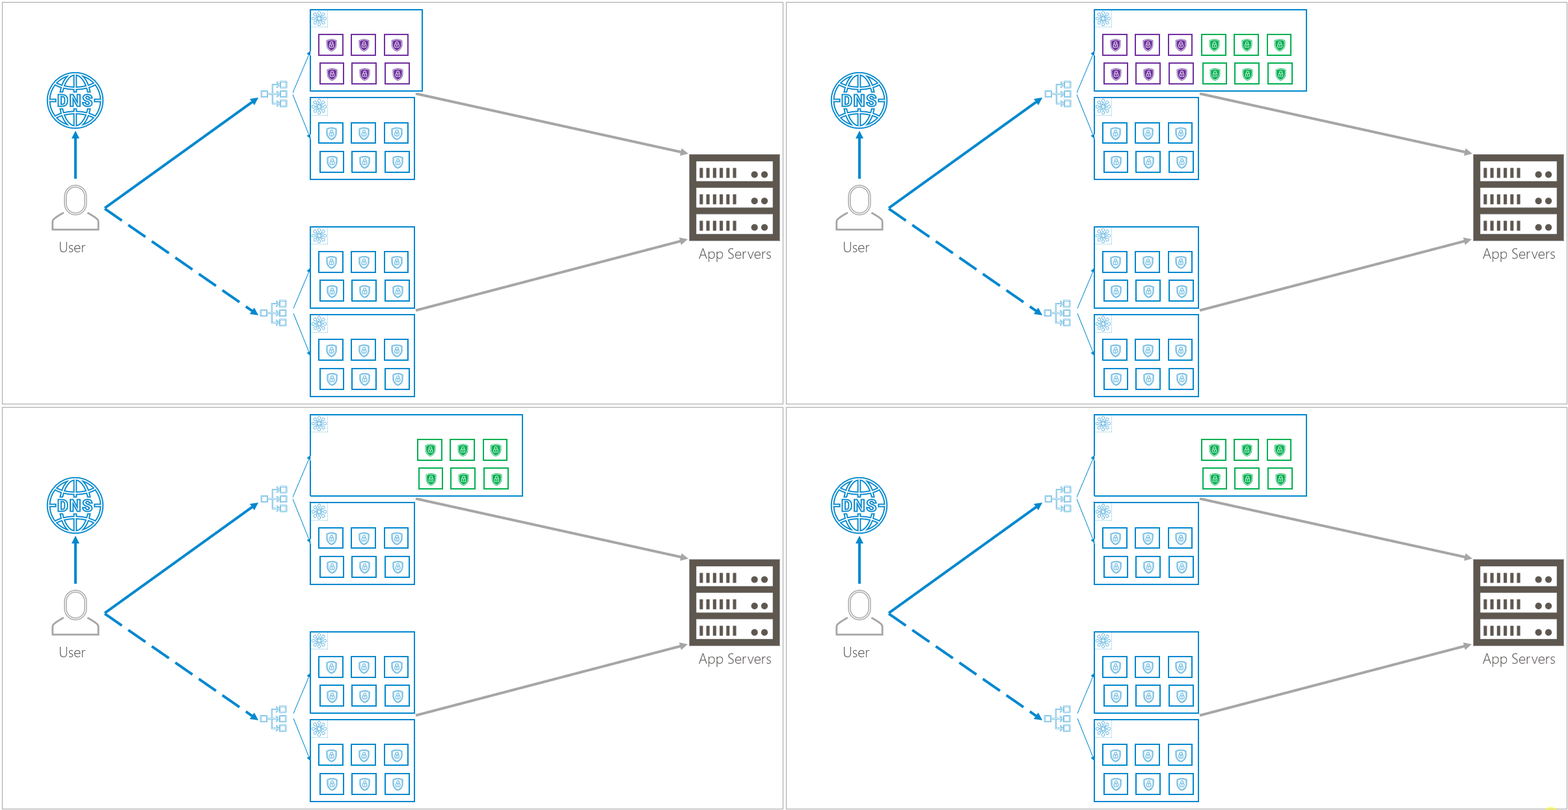
When Barracuda releases a new update, similar behavior makes the update seamless.
For example, to update a cluster, the infrastructure spins up redundant containers that are running the updated version. The infrastructure checks that the new containers are functioning properly and that traffic will flow to the new containers. It will then increase the flow of traffic to the new containers and reduce the flow of traffic to the old containers. Eventually, all traffic is routed to the new containers and the infrastructure removes the old containers.
To update the entire infrastructure, Barracuda updates one availability zone at a time within each region, then repeats the process in the next region – one availability zone at a time. During this process, there is no effect on traffic and no down time.
Management Path
After you specify your settings, Barracuda WAF-as-a-Service created the corresponding infrastructure without human interaction – it is created entirely by machine. This infrastructure is described as code (known as infrastructure-as-code or IAC) and is checked into a Git code repository (known as GitOps), which acts as the single source of truth. Then that code is used to propagate the actual infrastructure.
Automated Steps of the Management Path
This section describes the automated steps of the management path. After Step 1, where you specify your configuration, there is no additional human interaction.
- As a Barracuda WAF-as-a-Service user, you specify your configuration needs in Barracuda WAF-as-a-Service.
- That configuration is saved in the configuration database.
- As soon as the database changes, an automated process creates a desired infrastructure definition. This definition includes several files based on your configuration – including exact descriptions of infrastructure components of regions, availability zones, clusters, and containers.
- The files are checked into a Git code repository.
- As soon as the Git repository is changed, an automated build pipeline kicks off.
- This process takes files out of the Git repository and brings them into Terraform.
- Terraform reads the definition files and turns them into actual cloud infrastructure.
Terraform does not create an entirely new infrastructure every time. Rather, it finds the changes in the definitions and only creates the changes between the existing and updated infrastructure.

Logging
Barracuda WAF-as-a-Service stores the following types of logs:
- Access Logs – Every single HTTP/HTTPS transaction that passes through Barracuda WAF-as-a-Service
Access logs are the biggest part of Barracuda WAF-as-a-Service logging, because it includes all requests made to all users' applications. This is a vast amount of data.
Barracuda generates more than 500 GB of logs per day. Logs are retained for 45 days. - Firewall Logs – Every request blocked by Barracuda WAF-as-a-Service
- Event Logs – All events, including server health and certificates.
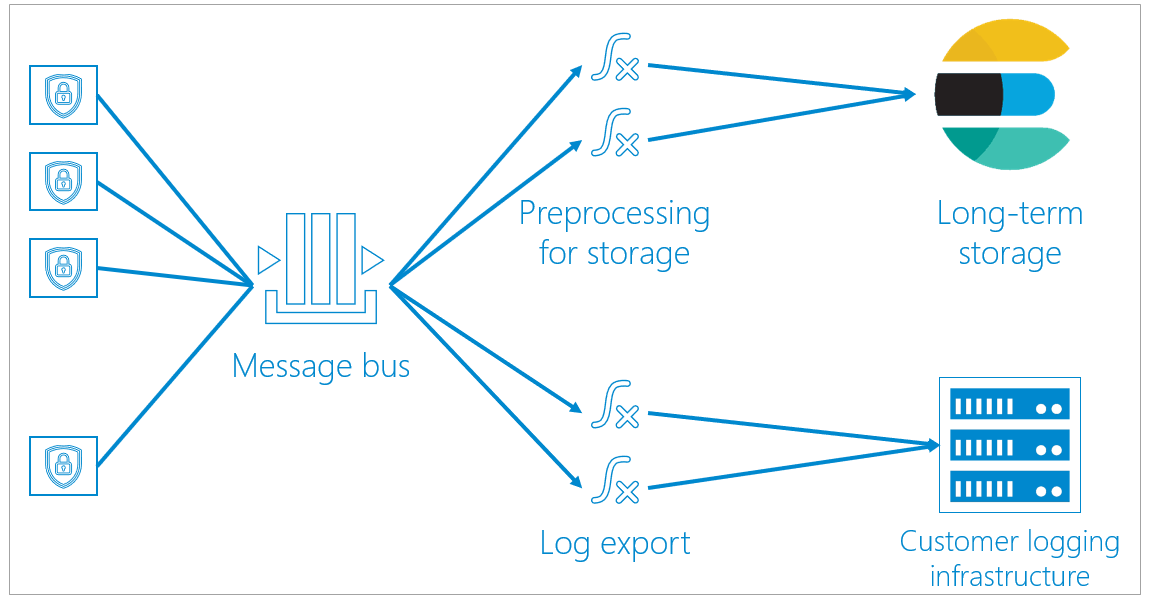
To handle access logs, Barracuda uses a centralized message bus, based on the Azure Event Hubs protocol.
- All containers send unprocessed logging information to the message bus.
- From the message bus, the logging data can take one of two paths:
- Some of the logging information is preprocessed for storage, then is sent to long-term storage. There, the log information is saved and can be queried and viewed on dashboards.
Preprocessing includes logic like IP lookups to correlate to countries. Processing the data here enables containers to focus on the data path, without taking time to process any logging information before it is dumped into the message bus. - If you specify that you want to export logging information and use your own logging infrastructure, that the logging information is exported as well as being stored in Barracuda storage.
- Some of the logging information is preprocessed for storage, then is sent to long-term storage. There, the log information is saved and can be queried and viewed on dashboards.
