The Barracuda Backup dashboards provide information about the health of your backup devices, backup health, replication health, storage statistics, and more.
Overview Dashboard
The Barracuda Backup overview dashboard is only visible to customers and Barracuda Networks partners that have more than one Barracuda Backup device linked to their account.
Device Dashboard
The Barracuda Backup device dashboard is visible on every Barracuda Backup device, except Barracuda Backup Virtual Receivers, which do not have a dashboard.
MULTI-APPLIANCE DASHBOARD
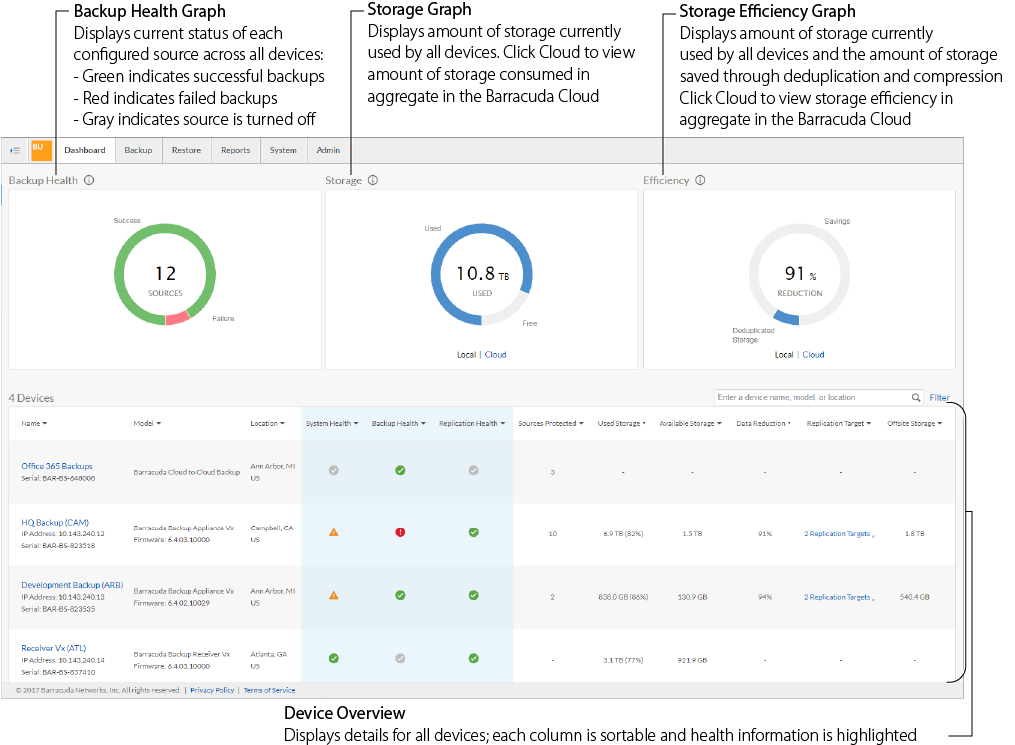
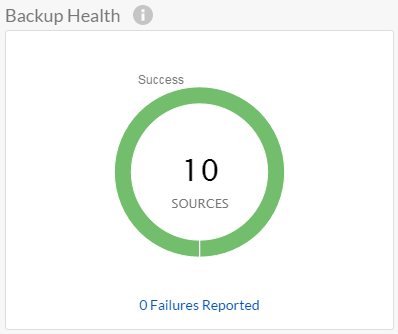
Backup Health Overview
The Backup Health graph shows the current status of each source configured across all Barracuda Backup devices. If the last backup that ran for a source was successful, it counts in the green success portion of the graph. If a source had a backup failure, it counts in the red failure portion of the graph. An inactive source is a source that is currently turned off on the Sources page.
Figure 3. Backup Health Graph.
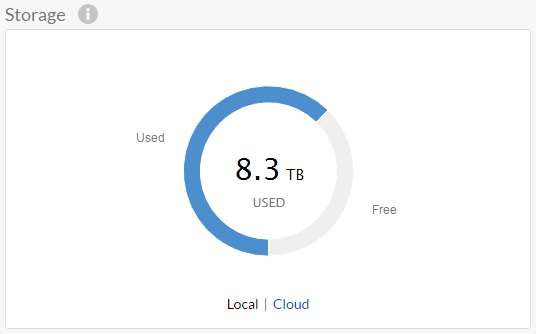
Storage Overview
The Storage graph shows the amount of storage currently being used by all Barracuda Backup devices in this view.
To view the amount of storage consumed in aggregate in the Barracuda Cloud, click Cloud below the Storage graph.
Figure 4. Storage Graph.
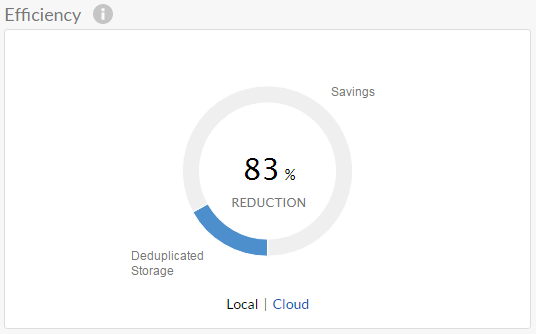
Storage Efficiency Overview
The Efficiency graph shows the amount of storage currently being used by all Barracuda Backup devices in this view and the amount of storage saved by Barracuda Backup deduplication and compression.
To view the storage efficiency in aggregate in the Barracuda Cloud, click Cloud below the Efficiency graph.
Figure 5. Storage Efficiency Graph.
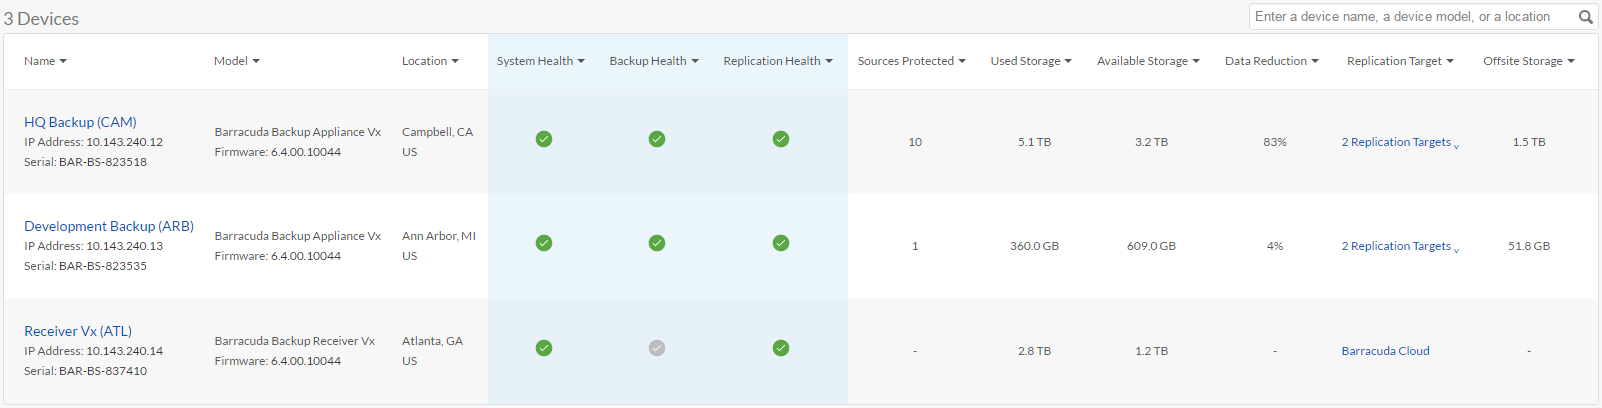
Devices Overview
The devices table shows all of the Barracuda Backup devices in the current view. Each column is sortable and health information is highlighted for effect.
Figure 6. Devices.
SINGLE APPLIANCE DASHBOARD
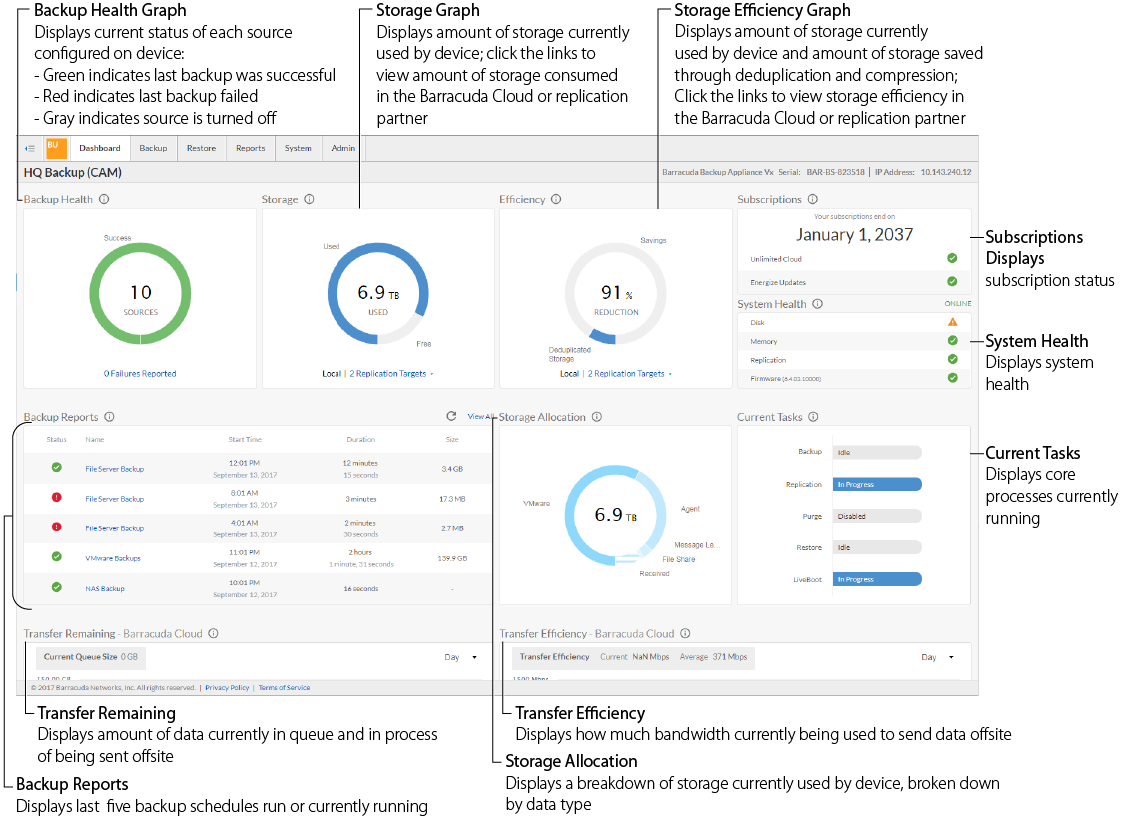
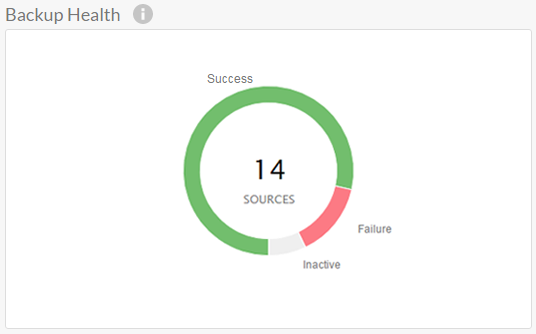
Backup Health
The Backup Health graph shows the current status of each source you have configured in Barracuda Backup. If the last backup that ran for a source was successful, it counts in the green success portion of the graph. If a source had a backup failure, it counts in the red failure portion of the graph. An inactive source is a source that is currently turned off on the Sources page.
To view which sources have failed, click the link below the Backup Health graph.
Figure 7. Backup Health Graph.
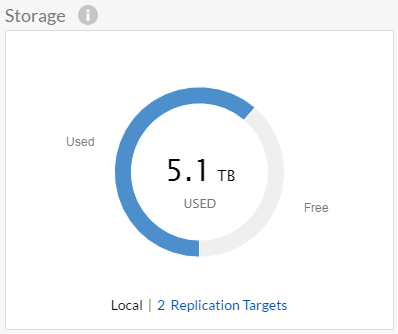
Storage
The Storage graph shows the amount of storage currently being used by your Barracuda Backup device.
To view the amount of storage consumed in the Barracuda Cloud or the amount of storage used on a Barracuda Backup replication partner, click on the links below the Storage graph.
Figure 8. Storage Graph.
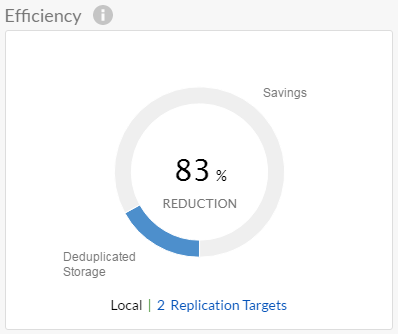
Storage Efficiency
The Efficiency graph shows the amount of storage currently being used by your Barracuda Backup device and the amount of storage saved by Barracuda Backup deduplication and compression.
To view the storage efficiency in the Barracuda Cloud or on a Barracuda Backup replication partner, click on the links below the Efficiency graph.
Figure 9. Storage Efficiency Graph.
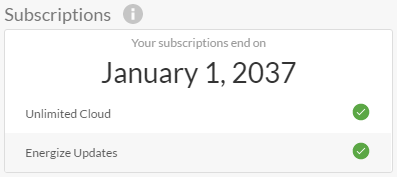
Subscriptions
View your subscription status.
Figure 10. Subscriptions.
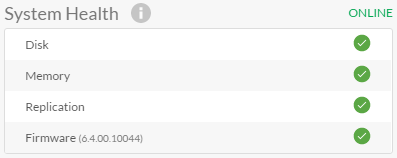
System Health
Figure 11. System Health.
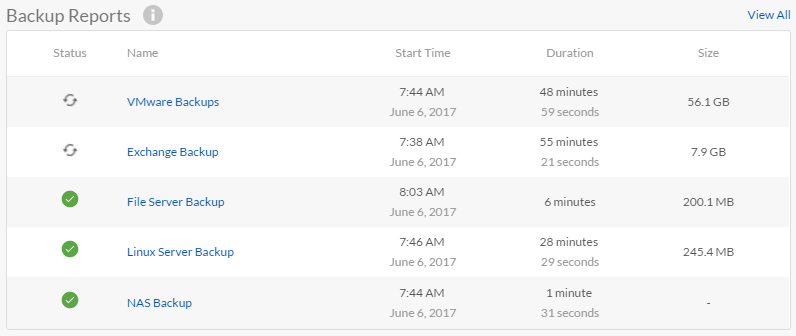
Backup Reports
Backup Reports shows the last five backup schedules that have run or are currently running. To view more backup reports, click View all in the upper right-hand corner. To view more details about a specific backup report shown in this widget, click the backup schedule name.
Figure 12. Backup Reports.
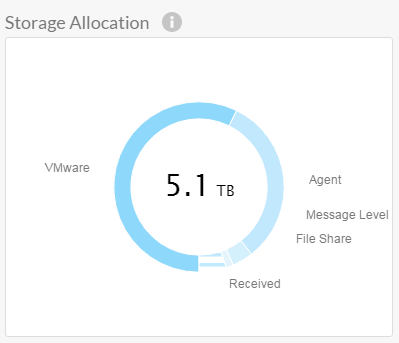
Storage Allocation
The Storage Allocation graph shows a breakdown of the storage currently being used by your Barracuda Backup device. The total amount of consumed storage is broken down into 6 possible data types:
- System – The amount of storage consumed by the operating system, Barracuda Backup software, and associated databases
- VMware – The amount of storage consumed by backed up VMware data sources
- Agent – The amount of storage consumed by data sources backed up with a Barracuda Backup Agent
- File Share – The amount of storage consumed by data sources backed up using the file sharing protocols CIFS and SSHFS
- Message-Level – The amount of storage consumed by the Microsoft Exchange Message-Level backup
- Received – The amount of storage consumed by data received from other Barracuda Backup devices (replication partners)
Figure 13. Storage Allocation Graph.
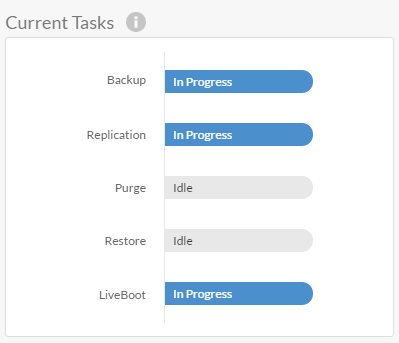
Current Tasks
Current Tasks shows you which core Barracuda Backup processes are currently running. The 5 processes are as follows:
- Backup – Data is currently being backed up
- Replication – Data is being replicated offsite to one or more locations or data is being received from one or more Barracuda Backup devices
- Purge – Data that is outside of retention is being removed from the device, freeing up disk space
- Restore – Data is currently being restored
- LiveBoot – A virtual machine has been booted either locally (LiveBoot) or in the cloud (Cloud LiveBoot)
Figure 14. Current Tasks.
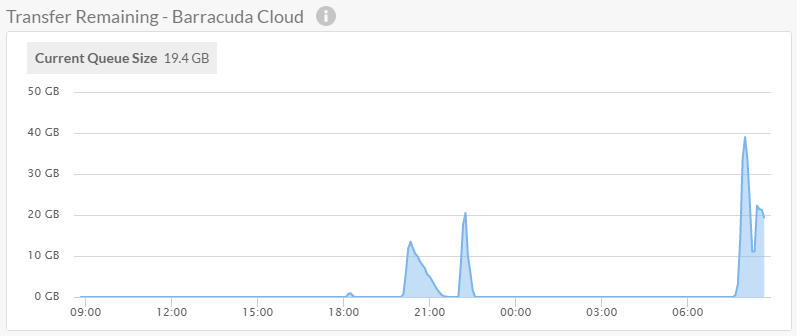
Transfer Remaining
The Transfer Remaining graph shows you how much data is currently in queue and in the process of being sent offsite.
Figure 15. Transfer Remaining Graph.
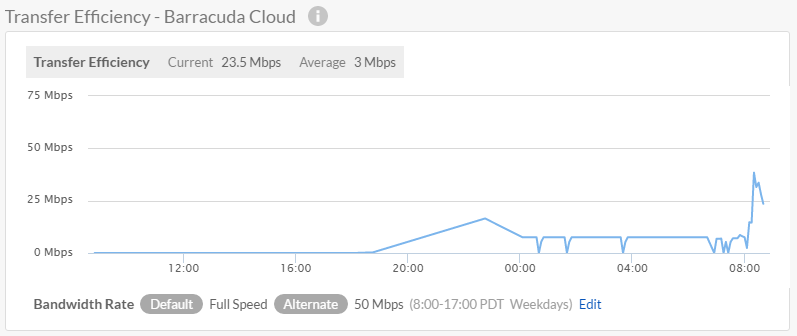
Transfer Efficiency
The Transfer Efficiency graph shows you how much bandwidth is currently being used to send data offsite.
Figure 16. Transfer Efficiency Graph.