

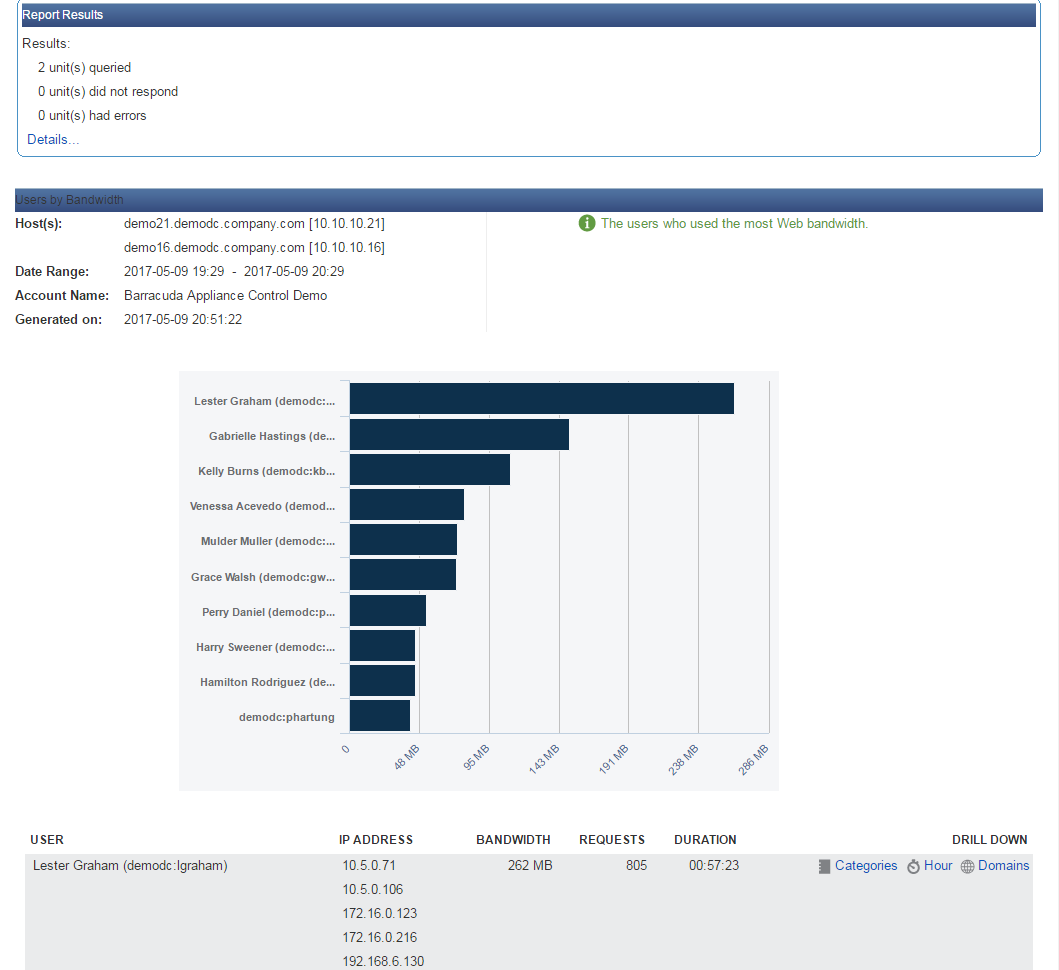
In this example you have connected two Barracuda Web Security Gateways to Barracuda Cloud Control and you want to run a report aggregating a list of "Users by Bandwidth" across all three devices. Run the report by clicking on the product tag Web Security Gateway from the Appliance Control pane. Navigate to the BASIC > Reports page, then click the Web Activity > Users by Bandwidth report.
As shown in Figure 1 below, for the Barracuda Web Security Gateways listed at the top of the report, an aggregated list of users shows in the table below the graph, sorted by the user with the most bandwidth used for the report time frame shown at the top.
Figure 1. Data aggregated across multiple Barracuda Web Security Gateways.
Troubleshooting with the Report Results Section
The Report Results section at the top of the report, shown expanded in Figure 2, shows the connected devices on which the report was created.
Figure 2. Report Results section showing connected devices.
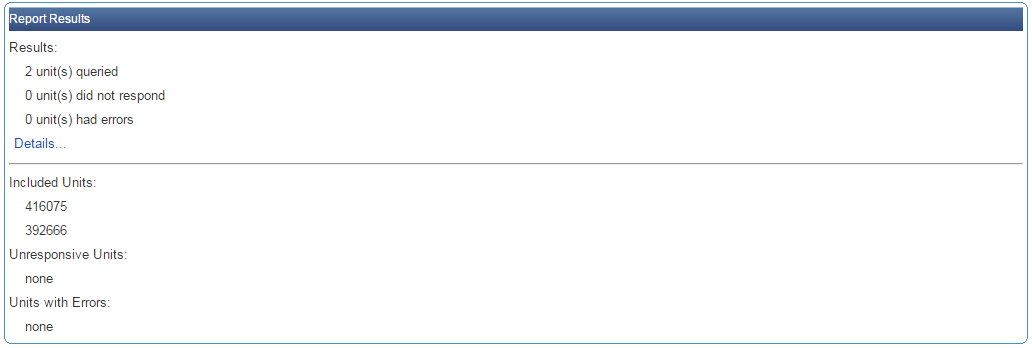
In this section, you can see if any units either did not respond or had errors. If there is an issue with a connected device, try directly logging into the web interface for that Barracuda Networks product. If you can, then you can use the troubleshooting features on the ADVANCED > Troubleshooting page for that device. Or you can open a support tunnel from the same page and call Barracuda Networks Technical Support if necessary. If you cannot log in directly from the web interface, you may need to check on the physical device.