The Network page lets you monitor the current status of the network subsystem. To access the Network page, open the CONTROL tab on the Barracuda CloudGen Firewall, and click the Network icon in the ribbon bar.

Information Display
The network information display is divided into two tables:
- The top table displays information about configured network interfaces, network addresses, and routes. To view this information, click the tabs that are below the table.
- The bottom table displays information about the routing tables.
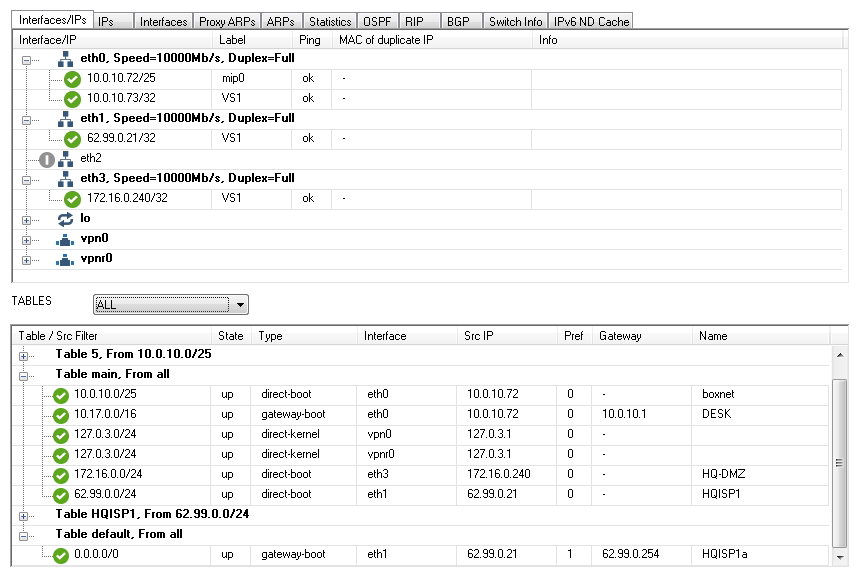
Interface/IPs Tab
To view information on network interfaces and the IP addresses that are assigned to them, click the Interfaces/IP tab.

In this table, information about each interface is organized into the following columns:
Interface/IP – The network interface names and their assigned IP addresses. For Ethernet network adapters, additional information on speed and duplex settings is also displayed. To expand and collapse the list of IP addresses with corresponding netmasks (inverted CIDR notation), double-click the interface name. The network interface type and network connection status are indicated by the following icons:
Network Interface Type Icons
Icon Description 
Ethernet network adapter. 
Loopback Interface. 
- Barracuda Netwokrs queuing interface (used for traffic shaping).
- DHCP interface, used for xDSL/DHCP connections.
- gre0, used for IP-to-IP tunnelling.

Tap interface (internal interface for SYN proxying & VPN. 
Tunnel Interface. Network Connection Status Icons
Icon Description 
Up. 
Not enabled. 
WWAN signal strength: no connection. 
WWAN signal strength: RSSI value below 10. 
WWAN signal strength: RSSI value from 21 to 31. 
Down or duplicate. - Label – A label is available for every interface that is 'up' (green icon). Multiple predefined labels are available, such as:
- mip0 – for the primary administrative network of the box.
- loop – for the loopback interface 127.0.0.1/24.
- fw – for network 127.0.1.1/24 on interface tap0.
- vpn – for network 127.0.2.1/24 on interface tap1.
- vpnpers – for network 127.0.3.1/24 on interface tap3.
- Ping – This column indicates whether the corresponding IP address is configured to reply to pings (ok) or not (NO).
- MAC of duplicate IP – If an IP address is used twice, the MAC address of the other interface is displayed in this column.
- Info – Contains additional information, if applicable.
IPs Tab
To monitor your networks, click the IPs tab. A list of your network addresses is displayed in the top table.

Information about each network address is organized into the following columns:
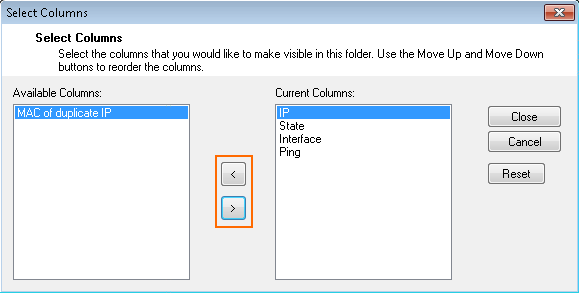
- IP – The network address.
- State – The status of the network.
- Interface – The interface that the network is assigned to. The interface name is displayed, followed by a colon and the interface label. E.g., eth0:mip0
- Ping – This column indicates whether the corresponding IP address is configured to reply to pings (ok) or not (NO).
- MAC of duplicate IP – If an IP address is used twice, the MAC address of the other interface is displayed in this column.
Changing Display Order Upon Selected Sort Criterion
By default, IPs are displayed in ascending order. This is indicated by the blue highlighted category label. The small triangle indicates the sort order of the displayed table entries, which can be either ascending or descending.
To change the sort order, click on the corresponding label of a table category.
Reordering Columns in the IPs Table
To reorder the columns in the process table, drag and drop the column header to your desired position.
Selecting Categories for Display in IPs Table
You can customize the categories of the columns shown in the IPs table.
To specify the information category of your choice, proceed as follows:
- Right-click in the display area of the IPs table.
- In the pop-up menu, click Select Columns....
- From the Available Columns table, select the category that you want to be displayed in the table.
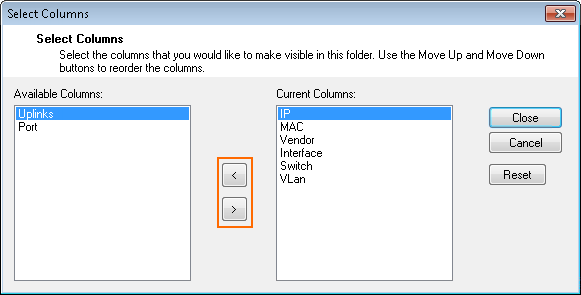
- Click on the > button to move the information field from the column Available Columns to the Current Columns. Entries in the table Current Columns will be displayed in the list order. Click on the < button to remove the category from the values to be displayed.
- Click Close to apply the changes.
Interfaces Tab
To view the settings for your network interfaces, click the Interfaces tab.

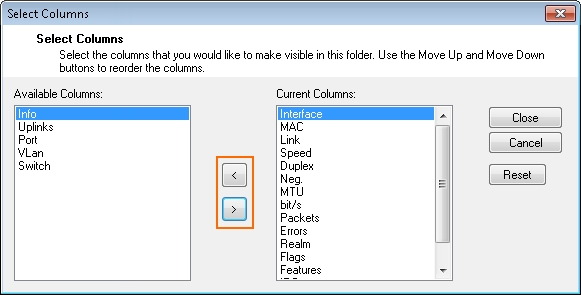
A list of your interfaces is displayed in the top table. Information about each interface is organized in the following columns:
- Interface – The interface name. If the link of an interface is down, this is indicated by a grey icon and the keyword 'DOWN' in the Link column.
- MAC – The unique MAC address for the interface.
- Link – Indicates whether the interface is physically connected.
- Speed – For adapters, the maximum transfer rate in Mbit/s.
- Duplex – The duplex settings of the NIC (Half or Full).
- Neg. – Indicates if auto-negotiation is on or off.
- MTU – The Maximum Transmission Unit (MTU) of the NIC.
- Bytes – The byte throughput, which is calculated by the average number of bytes/s (obtained from a 10-second sampling interval) passing through the interface.
- Packets – The packet throughput, which is calculated by the average number of packets/s (obtained from a 10-second sampling interval) passing through the interface.
- Errors – The total number of errors, which is calculated by the average number of all errors on the interface (obtained from a 10-second sampling interval).
- Trust Level – The Trust Level.
- Flags – The following entries are possible:
- UP – The interface is up.
- BROADCAST – Broadcast active.
- LOOPBACK – Loopback active.
- NOARP – ARP requests will not be responded.
- POINT-TO-POINT – Used for PPTP.
- PROMISC – Accepts every packet, regardless of whether the MAC address matches.
- Features – The following entries are possible:
- SGI/O 0 – Gather Input/Output (DMA).
- NOCSUM – No checksum required.
- HWCSUM – Interface is capable of hardware checksum.
- IPCSUM – Interface is capable of checksum for IP packets.
- HW-VLAN-TX – Interface is capable of VLAN tagging transmits.
- HW-VLAN-RX – Interface is capable of VLAN tagging receives.
- HIGH-DMA – I/O memory above 64 K.
- DYNALLOC – Used for virtual interfaces.
- IRQ – The IRQ number (ReQuest line) for each interface.
- Base-Addr – The I/O port address.
- Switch – The switch, if configured.
Changing Display Order upon Selected Sort Criterion
By default, interfaces are displayed in ascending order. This is indicated by the blue highlighted category label. The small triangle indicates the sort order of the displayed table entries, which can be either ascending or descending.
To change the sort order, click on the corresponding label of a table category.
Reordering Columns in the Interfaces Table
To reorder the columns in the process table, drag and drop the column header to your desired position.
Selecting Categories for Display in the Interfaces Table
You can customize the categories of the columns shown in the Interfaces table.
To specify the information category of your choice, proceed as follows:
- Right-click in the display area of the Interfaces table.
- In the pop-up menu, click Select Columns....
- From the Available Columns table, select the category that you want to be displayed in the table.
- Click on the > button to move the information field from the column Available Columns to the Current Columns. Entries in the table Current Columns will be displayed in the list order. Click on the < button to remove the category from the values to be displayed.
- Click Close to apply the changes.
Proxy ARPs Tab
Proxy ARPs are additional IP addresses/netmasks that the firewall responds to. To view the list of proxy ARPs, click the Proxy ARPs tab.

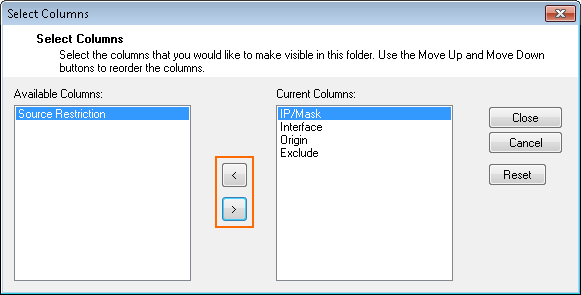
In the Proxy ARP table, information about each proxy ARP is organized into the following columns:
- IP/Mask – The IP addresses/netmasks.
- Interface – The interface where the IP address/netmask resides.
- Origin – The origin of the proxy ARP (by whom it is created).
- Exclude – The networks that are excluded from proxy APR creation.
- Source Restriction – The network addresses to which the proxy ARP request has been limited.
Changing Display Order upon Selected Sort Criterion
By default, Proxy ARPs entries are displayed in ascending order. This is indicated by the blue highlighted category label. The small triangle indicates the sort order of the displayed table entries, which can be either ascending or descending.
To change the sort order, click on the corresponding label of a table category.
Reordering Columns in the Interfaces Table
To reorder the columns in the process table, drag and drop the column header to your desired position.
Selecting Categories for Display in the Proxy ARPs Table
You can customize the categories of the columns shown in the Proxy ARPs table.
To specify the information category of your choice, proceed as follows:
- Right-click in the display area of the Proxy ARPs table.
- In the pop-up menu, click on Select Columns....
- From the Available Columns table, select the category that you want to be displayed in the table.
- Click on the > button to move the information field from the column Available Columns to the Current Columns. Entries in the table Current Columns will be displayed in the list order. Click on the < button to remove the category from the values to be displayed.
- Click Close to apply the changes.
ARPs Tab
The Address Resolution Protocol (ARP) is needed for translating an IP address into a physical address. To view the list of ARP requests, click the ARPs tab.

In the ARPs table, information about each ARP is organized into the following columns:
- IP – The IP addresses that were used.
- MAC – The MAC address of each assigned IP address.
- Vendor – The manufacturer of the network interface.
- Interface – The interface.
Changing Display Order upon Selected Sort Criterion
By default, ARP entries are displayed in ascending order. This is indicated by the blue highlighted category label. The small triangle indicates the sort order of the displayed table entries, which can be either ascending or descending.
To change the sort order, click on the corresponding label of a table category.
Reordering Columns in the Interfaces Table
To reorder the columns in the process table, drag and drop the column header to your desired position.
Selecting Categories for Display in the ARPs Table
You can customize the categories of the columns shown in the ARPs table.
To specify the information category of your choice, proceed as follows:
- Right-click in the display area of the ARPs table.
- In the pop-up menu, click Select Columns....
- From the Available Columns table, select the category that you want to be displayed in the table.
- Click on the > button to move the information field from the column Available Columns to the Current Columns. Entries in the table Current Columns will be displayed in the list order. Click on the < button to remove the category from the values to be displayed.
- Click Close to apply the changes.
Statistics Tab
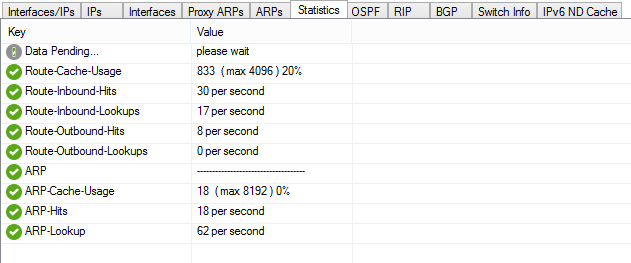
Shows statistics about the routing and ARP cache utilization of the firewall. This information can be useful when optimizing the size of the routing and ARP cache. For more information, see How to Configure Advanced Barracuda OS System Settings
OSPF, RIP, and BGP Tabs
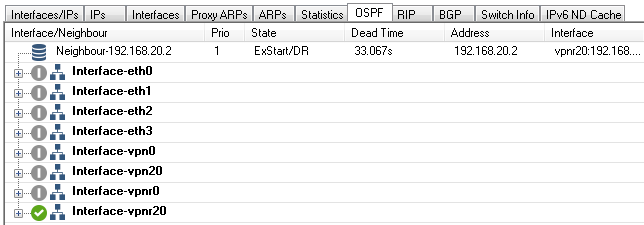

If you configured the OSPF, RIP, or BGP service on your system, click the OSPF, RIP, or BGP tab to view information about the neighbors and interfaces.
For more information, see Dynamic Routing Protocols (OSPF/RIP/BGP).
Switch Info
Only available with a managed layer 3 switch.
IPv6 ND Cache
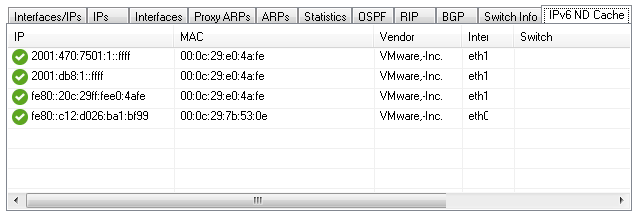
Displays the content of the IPv6 neighbor discovery cache. For more information, see IPv6.
(Azure Firewalls Only) Azure UDR

CloudGen Firewalls in Azure can manipulate the Azure User Defined Routing (UDR) table to change the routing table for the backend VMs in case of a failover. This tab shows the User Defined Routing table that is currently active for this cloud service. Gray routes are routes that do not use a CloudGen Firewall as the destination. A red status indicates that the changes to the routing table are currently in progress.
For more information, see How to Configure a High Availability Cluster in Azure using PowerShell and ARM.
Routing Tables
In the bottom table on the Network page, you can view information about your routing tables. If you have not configured policy routing, information is only provided for the main and default tables. Default routes are contained in the default table.

To display information for only certain routing tables, select the table name from the TABLES list. Without policy routing activated, all routes except the default routes will go into the main table. Default routes go into the default table. With policy routing activated, additional tables become available as specified in the configuration dialog. In the table, information for each route is organized into the following columns:
- Table / Src Filter – The routing table name and its routed netmasks. This column lists routing tables by name. To expand and collapse the list of netmasks for a table, double-click the table name.
- State – The state of the routing. Available entries are up, down, wild, disabled, and off.
- Type – The route type:
- Direct – Direct routes point to directly connected networks. No next hop is involved. The network is directly accessible via the specified interface.
- Gateway – Gateway routes are routes to networks that are only accessible via a next hop. The next hop must be reachable through a direct route.
Interface – The interface through which traffic to the destination network passes.
Src IP – The route source IP address.
- Pref – The preference of the route, with 0 indicating the highest preference.
- Gateway – The address of the next hop for gateway routes. For direct routes, this field is left empty (denoted by a single -).
- Name – The given name of the route. For source-based routes into a VPN tunnel, this field contains the name of the VPN tunnel.
Wild Routes
If you added routes at the command line, or deleted direct and gateway routes with a 'Soft' network activation, you might see routes that are marked as wild. These are routes for which there is no corresponding entry in the network configuration file. To delete a wild route, right-click it and select Delete Wild Route.
