The Resources page provides information on active processes on the Barracuda CloudGen Firewall, such as the machine uptime, number of logged-in users, load average, and memory usage. To access the Resources page, open the CONTROL tab and click the Resources icon in the ribbon bar.

Processes Section
The processes section gives an overview of all active processes running on the CloudGen Firewall.
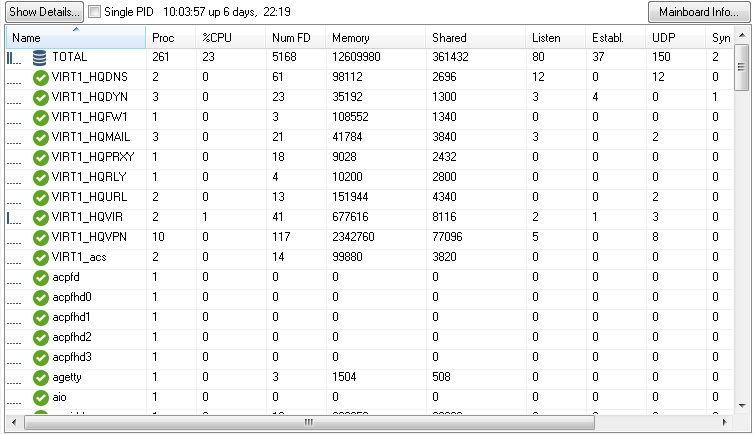
The table header includes additional control elements that allow you to control the display of process information.
- Show Details... – Get detailed information on an active process.
- Single PID – If checked, child processes in the table are also displayed.
- HH:MM:ss up X days – Uptime of the firewall since last restart.
- Mainboard Info... – Get detailed information on the mainboard of the firewall.
The Processes table shows information on active processes. You can also view detailed information on a selected entry and track each task to a single process.
Information for each process or process group is organized in the following columns:
Name – The name of the process. Small graphical bars to the left of the name indicate the CPU load in percent, ranging from 0%, 10%, 25%, 50%, 70% to 90%.
- Proc – The number of processes with the same name.
- %CPU – The percentage of CPU load that is used.
- Num FD – The number of file descriptors used by processes with this name.
- Memory – The amount of memory (in kB) used exclusively by processes with this name.
- Shared – Shared memory in kB is used by processes with this name.
- Listen – The number of listening TCP sockets owned by processes with this name.
- Establ. – The number of established sockets owned by processes with this name.
- UDP – The number of UDP sockets owned by processes with this name.
- Syn Sent – The number of unanswered SYN packets sent by processes with this name / the number of unanswered SYN packets for which the timeout has not yet expired.
- Close – The number of sockets owned by processes with this name.
- Last ACK – The number of sockets in state LAST_ACK owned by processes with this name.
Order of Processes
By default, processes are displayed in ascending order by their name. This is indicated by the blue highlighted category label. The small triangle indicates the sort order of the displayed table entries, which can be either ascending or descending.
To change the sort order, click on the corresponding label of a table category.
Reordering Columns in the Process Table
To reorder the columns in the process table, drag and drop the column header to your desired position.
Selecting Categories for Display in the Processes Table
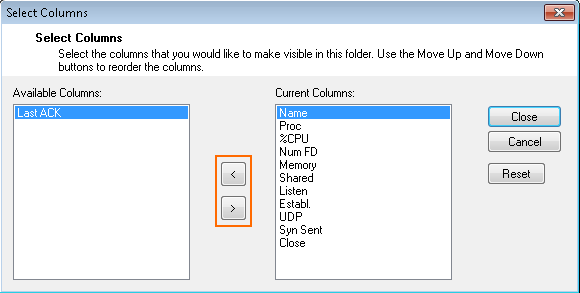
You can customize the categories of the columns displayed in the process table.
To specify the information category of your choice:
- Right-click inside of the display area of the processes table.
- In the pop-up menu, click on Select Columns....
- From the Available Columns table, select the category that you want to be displayed in the process list.
- Click on the > button to move the information field from the column Available Columns to the Current Columns. Entries in the table Current Columns will be displayed in the list order. Click on < to remove the category from the values to be displayed.
- To apply the changes, click Close.
Viewing Process Details
To view details on a running process:
- Select a process in the process list table.
- Click Show details... at the top left of the table.

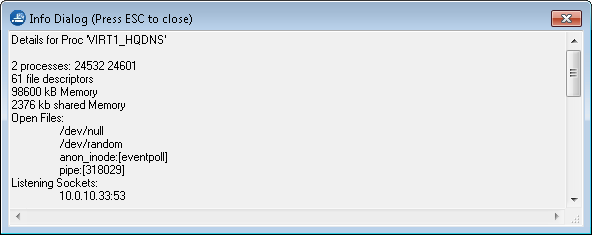
The Info Dialog window opens with the following information on the selected process:
- The process IDs of all processes with the same name.
- Detailed list of all open files.
- The IP addresses and ports of listening TCP sockets.
- The local IP:port and remote IP:port combinations of all established sockets.
- The IP addresses and ports of UDP sockets.
Displaying Subprocesses
Processes can create a hierarchical order of child processes. The list is updated every two seconds and includes all child processes.
Check the box Single PID to show child processes in the list.

Displaying Information on the Mainboard
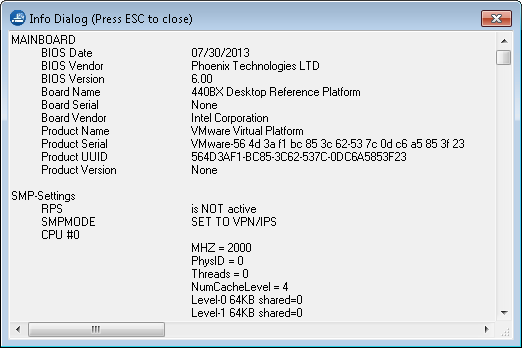
Click Mainboard Info... to display information onthe mainboard.

The Mainboard Info window opens with a detailed breakdown of technical information on your underlying system.
System Section
The system section displays the usage of RAM and disk space in real-time. For hardware systems, you can also view the temperature and fan speed. (CD-ROMs and floppy disks are not displayed.)
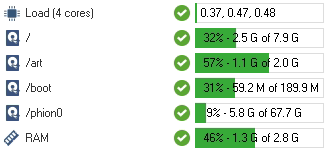
The following information is provided:
- CPU – Displays the current CPU load of the CloudGen Firewall.
- Disk Space – Displays real-time usage of all currently mounted file systems. Each file system is identified by its mount point. In a default installation of the CloudGen Firewall, the following file systems at a minimum should be present:
- / – Root directory.
- /boot – Directory for boot images (usually located at the beginning of a disk).
- /phion0 – Directory for logs and statistical data.
- RAM – Displays the real-time usage of RAM.
- Temperature – Displays the temperature of the mainboard and CPU.
- Fan Speed – Displays the speed of the chassis fan.
