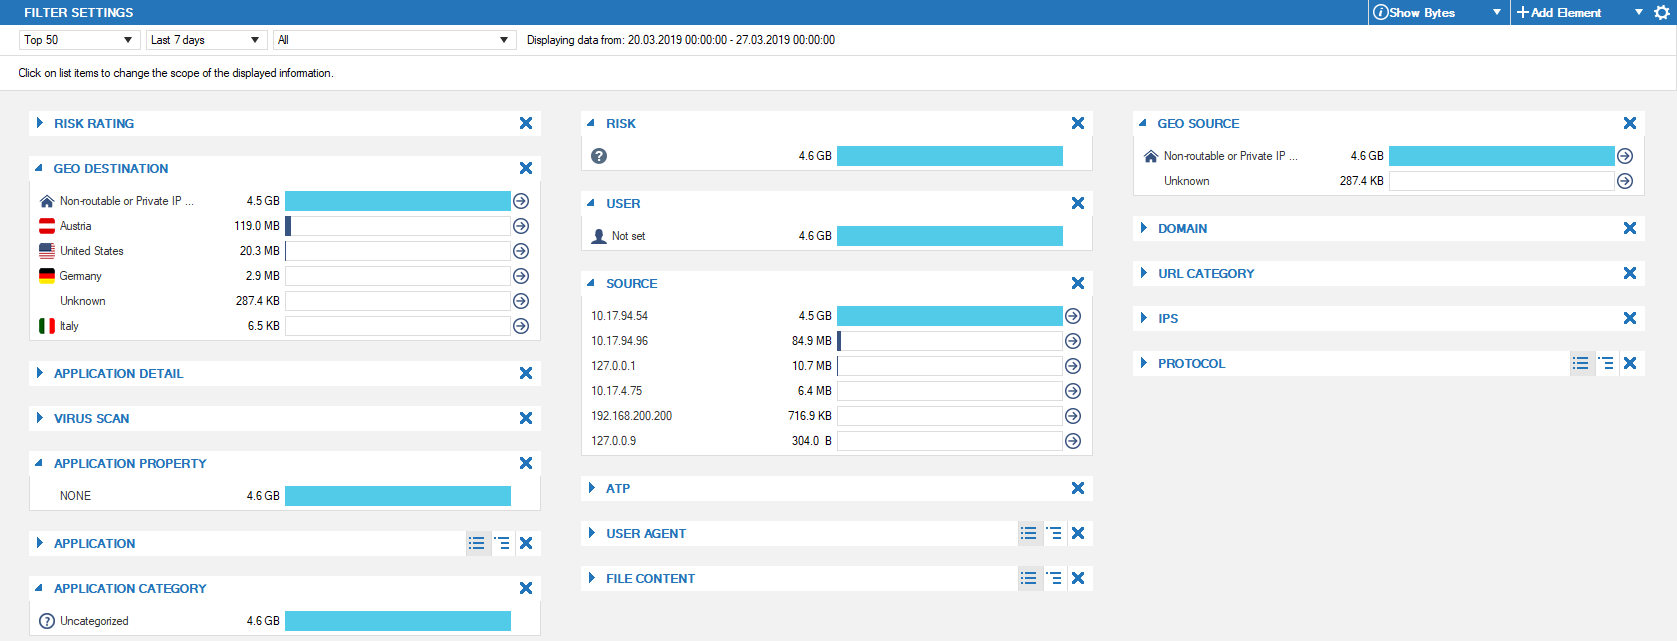
The Monitor page gives you real-time statistics on your network traffic. The Monitor page displays all detected applications, protocols, content, and threats, and provides information on the clients creating the traffic. You can adjust the database storage size for the monitored data in the firewall statistics policy settings (For more information, see General Firewall Configuration). To access the Monitor page, open the FIREWALL tab and click the Monitor icon in the service bar.

The Monitor page lists all currently detected application traffic by load or sessions (depending on the filters you apply) that is forwarded by the firewall. The application traffic statistics are divided into the following sections:
- Risk Rating – Displays the overall risk rating of all applications that apply to currently displayed traffic information.
- Application Detail – Allows in-depth inspection of the application rule handling process.
- URL Category – Provides traffic load information related to URL categories.
- ATP – Shows traffic affecting Advanced Threat Protection (ATP), if configured.
- Application Property – Provides traffic load information related to application properties.
- Botnet and Spyware Protection – Provides traffic load information related to botnet and spyware detection.
- File Content – Provides traffic load information related to application content.
- Application Category – Provides traffic load information related to categories.
- Geo Source – Displays the geographic location of the application source, if available.
- Geo Destination – Displays the geographic location of the application destination, if available.
- User – Provides information on users and groups that are accessing the application.
- User Agent – Displays the user agents for HTTP and HTTPS connections.
- Domain – Displays the domains involved in the application rule handling process.
- Source – Provides information on the application source, if available.
- Virus Scan – Provides traffic load information related to virus and malware detection.
- IPS – Shows traffic affecting the Intrusion Prevention System (IPS).
- Application – Displays the applications that are referred to by application rules as soon as the rules apply to incoming or outgoing network traffic.
- Protocol – Displays the protocols that the applications affect and that are involved in the application rules process.
- Risk – Provides traffic load information related to risk levels (1 - 4).
To view or collapse a section, click the arrow icon to the left of each section heading.

To show or hide an entire section, click Add Element on the top right of the page, and chose the sections you want.

Filtering Functions
The FILTER SETTINGS section on top of the page provides drop-down menus that allow you to filter for the following criteria:
- Applications – Show all application traffic or drill down the displayed information to a selected number of top applications.
- Time – Select a time interval for application traffic information to be displayed. Information can be displayed on an hourly, daily, weekly, or monthly basis.
- Traffic Type – Filter display information based on application traffic affected by the Virus Scanner, Intrusion Prevention System (IPS), and Advanced Threat Protection (ATP). For example, select Blocked to filter for traffic blocked by application rules.

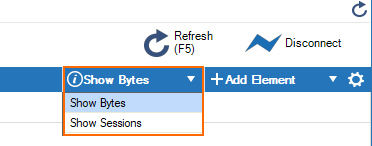
Expand the drop-down menu on the upper right to toggle displayed traffic information by bytes or the number of sessions.

Managing Traffic Information
Some sections, such as Application or URL Category, provide links to the Live and History views. When you click the arrow icon next to the entry, the Live or History page opens and automatically applies a filter for the selected application.

Some sections, such as Application or Protocol, offer icons to change the list to a flat or grouped display.

Clicking an entry in the Application section opens an information display window under the Filter Settings section. To exit the selection and return to standard view, click x.

