The Control Center SD-WAN page provides a geographic map interface for fast access to frequently needed CloudGen Firewalls with configured site-to-site VPN tunnels, showing real-time statistics of SD-WAN traffic. To display tunnel status information on the SD-WAN page, go to Global Settings > CC Parameters and enable Poll Box VPN Status. To access the SD-WAN page, click the CONTROL tab and select the SD-WAN icon.
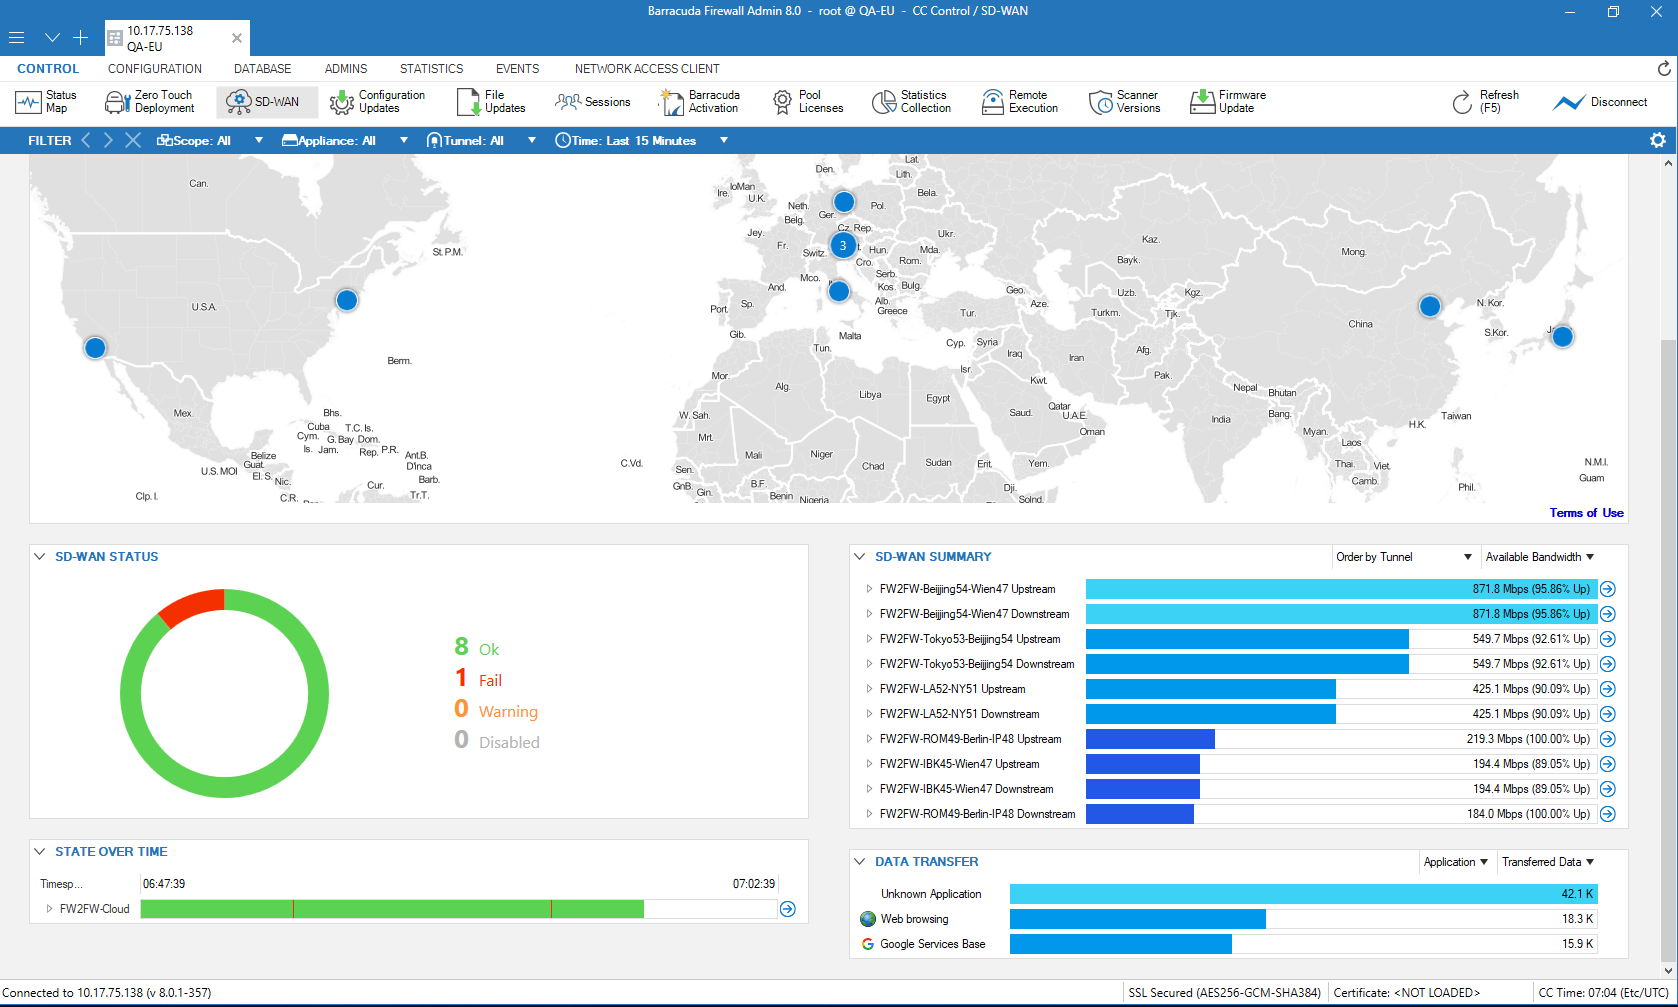
The following elements provide information on the SD-WAN dashboard:
- Topology
- SD-WAN Status
- SD-WAN Summary
- State Over Time
- Data Transfer
Topology
The Topology element provides a global overview of Control Center-managed Barracuda CloudGen Firewalls with configured VPN tunnels that have been added to the Status Map page. For more information, see CC Status Map Page. Locations with VPN tunnels are displayed as blue circles; firewalls that are deployed in a Cloud are displayed in violet. To view details such as firewall name and number and status of configured VPN tunnels, move the mouse over a point on the map. Use the mouse wheel to zoom the display in and out.
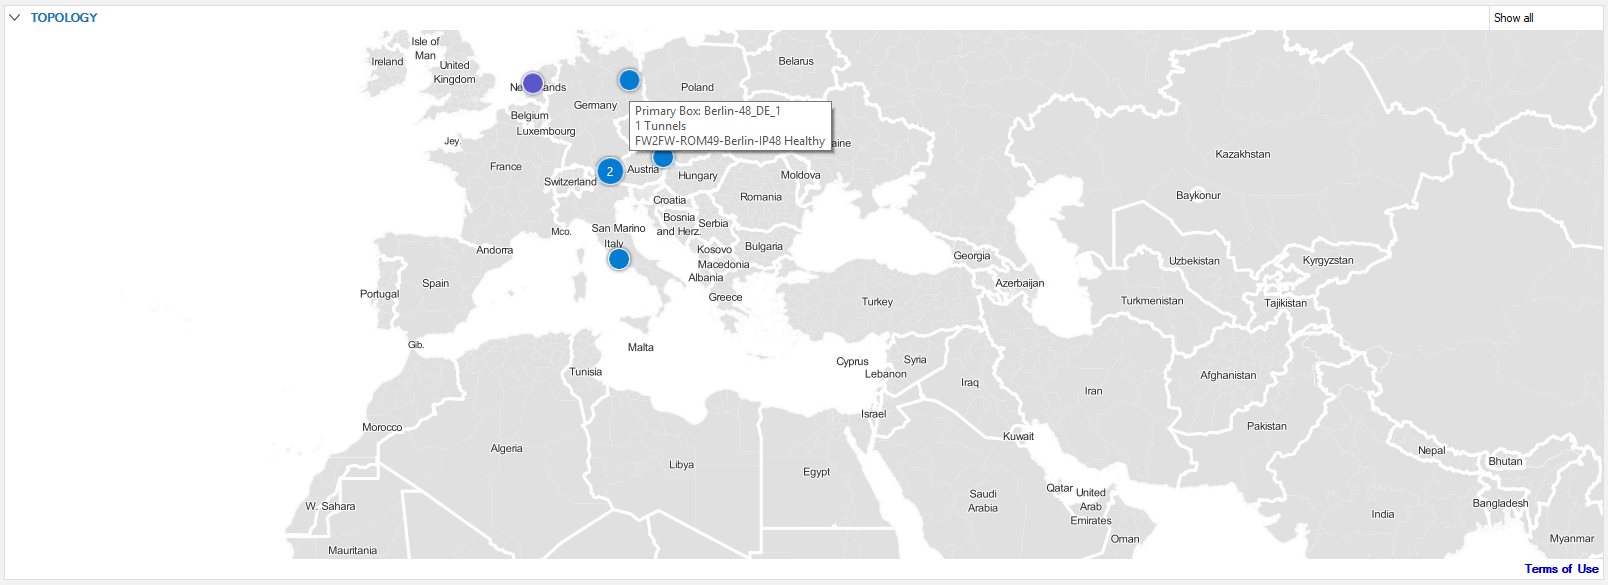
Right-clicking in the window directly on a location opens a dedicated context menu with the following entries:
- Connect to Primary – Opens the VPN > Site-to-Site window, displaying the details of the primary VPN tunnel of the selected appliance as a new tab inside the current Barracuda Firewall Admin instance. For more information, see VPN Tab.
- Connect to Secondary (if configured) – Opens the VPN > Site-to-Site window of the selected appliance as a new tab, displaying the details of the secondary VPN tunnel. For more information, see VPN Tab.
In case of HA, login is only possible for the active firewall.
SD-WAN Status
The SD-WAN Status element displays a graph showing the status of the configured VPN tunnels in numbers and percentage, indicated by different colors.
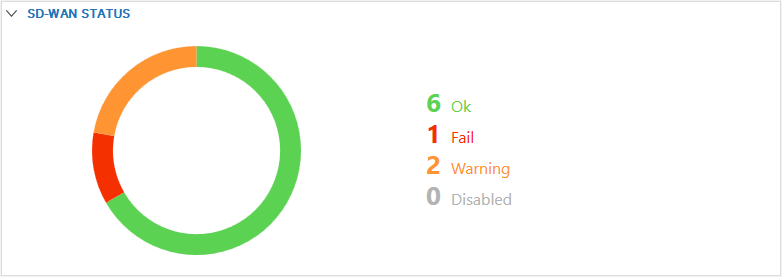
The chart provides the following details:
- Ok – Shows the number of active healthy VPN connections.
- Fail – Shows the number of VPN tunnels with status Fail.
- Warning – Shows the number of VPN tunnels with status Warning.
- Disabled – Shows the number of VPN tunnels with status Disabled.
For detailed information on the different VPN tunnel states, see the Status Section in VPN Tab.
State Over Time
The State Over Time element provides time-based information on the traffic that flows through VPN tunnels on which issues have been detected, according to the configured filter. Healthy tunnels are not listed here.

When expanded for a VPN tunnel, additional lines display the traffic details according to configured VPN transport classes. Click the arrow icon on the left of an entry to expand the SD-WAN traffic details:
- Bulk – Shows the statistics for cheap and potentially unreliable connections classified as Bulk in the SD-WAN configuration.
- Quality – Shows the statistics for more reliable connections, classified as Quality.
- Fallback – Shows the statistics for the most expensive connections, classified as Fallback.
For more detailed information, see SD-WAN.
The colors of the lines indicate the connection status.
Possible State over Time colors for tunnels:
- White – Unknown, no data from CC.
- Grey – Tunnel status is Offline.
- Green – Tunnel status is Healthy.
- Orange – Tunnel status is Degraded.
- Red – Tunnel status Down.
Possible state over Time colors for transports:
- White – Unknown, no data from CC.
- Green – All transports of the tunnel are up.
- Grey – Transport is down (disabled/switched off).
- Red – Transport status is Fail.
- Blue – Transport status is Standby.
SD-WAN Summary
The SD-WAN Summary element displays the bandwidth consumed by your top 10 VPN tunnels according to the configured filter.
The following screenshot shows a list of appliances in the SD-WAN. Note that the left column contains entries with the terms 'Upstream' and 'Downstream'.
- Upstream – Relates to the source appliance where traffic is sent from, e.g., 'FW2FW-Beijing54-Wien47 Upstream'.
- Downstream – Relates to the destination appliance where traffic is received, e.g., 'FW2FW-Beijing54-Wien47 Downstream'.
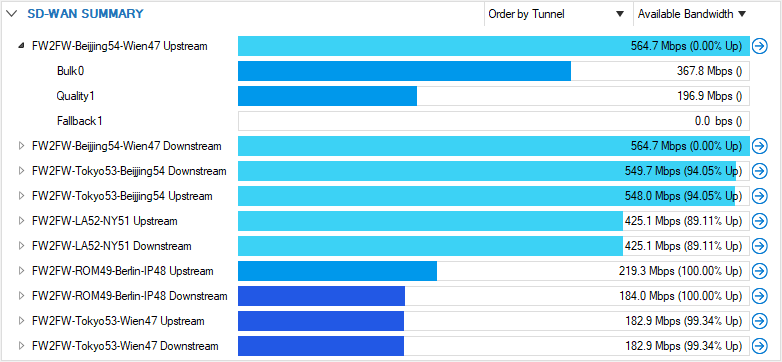
Click the arrow icon on the left of an entry to expand the SD-WAN traffic details.
- Bulk – Shows the statistics for cheap and potentially unreliable connections classified as Bulk in the SD-WAN configuration.
- Quality – Shows the statistics for more reliable connections, classified as Quality.
- Fallback – Shows the statistics for the most expensive connections, classified as Fallback.
Available Actions
Clicking the menu in the top-right corner of the SD-WAN Summary element offers the following actions:
- Order by Tunnel – Orders the list of information entries by VPN tunnel name.
- Order by Box Upstream – Orders the list of information entries by traffic upstream.
- Order by Box Downstream – Orders the list of information entries by traffic downstream.
To filter the entries by traffic, select one of the following options:
- Latency – Orders the list by Round Trip Time (RTT).
- Available Bandwidth – Orders the list by available bandwidth.
- Used Bandwidth – Orders the list by the bandwidth consumed by your VPN tunnels.
- Bandwidth usage – Orders the entries by traffic usage.
Data Transfer
The Data Transfer element displays the summary of bandwidth consumed by applications and protocols.

Click on the top right of the element to filter the selection according to:
- Application – Displays data consumption details according to applications used.
- Protocol – Displays data consumption details according to protocols used.
- Transferred Data – Displays traffic information showing the general data transfer.
- Upstream – Displays the amount of kilobytes used by upstream traffic.
- Downstream – Displays the amount of kilobytes used by downstream traffic.
Filter Options
The Filter bar on top of the page provides drop-down menus that allow you to filter for the following criteria:
- Scope – Show the statistics for all locations the Barracuda CloudGen Firewalls reside in, or select a scope to be displayed.
- Appliance – Show the statistics for all Barracuda CloudGen Firewalls, or drill down the displayed information to a selected number of appliances.
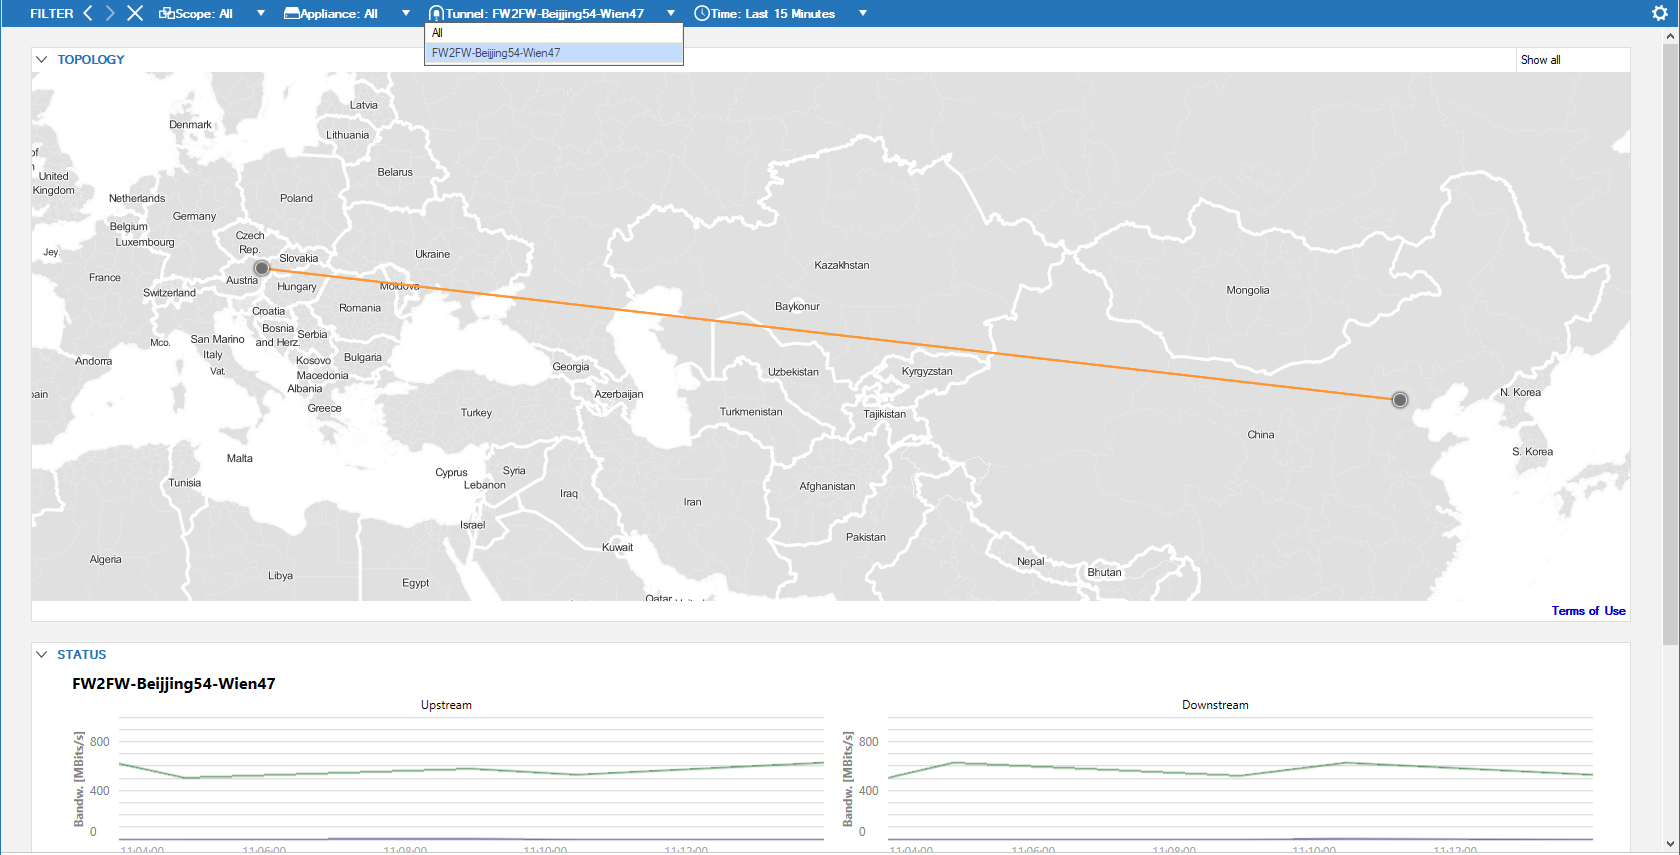
- Tunnel – Allows a filter to be set for a specific tunnel name.
- Time – Lets you select a time interval for VPN traffic information to be displayed.
To apply a filter and / or selection, click the white arrow on the right of each field, expand the context drop-down menu, and make a selection according to your requirements.
To apply a filter for a connection, click the arrow icon next to an entry in the SD-WAN Summary or State Over Time element and select Set as Filter.
