

Barracuda Networks offers a report of detections that can be manipulated by setting column filters or choosing what and how data will be displayed.
To access the Data Inspector report, click on the Reports icon ![]() in the left-side navigation.
in the left-side navigation.
Barracuda’s Built In Report
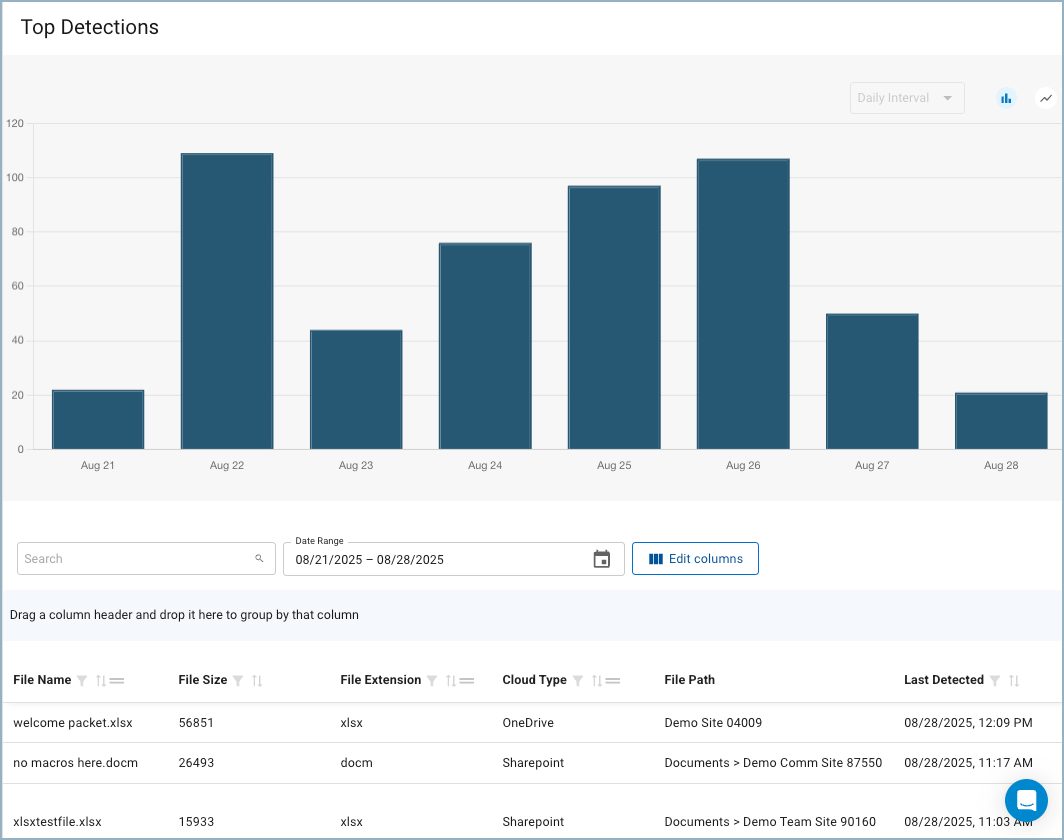
Found on the Reports page in the left navigation, this reports is designed to provide robust information about the top files detected over the previous week.
Customize and Save Reports
Each report can be customized in various ways. Once a report is to your liking, you can name and save it for future use. The new report is then found in the left navigation under My Reports. Once saved, new data is displayed matching your customization.
Time format
Depending on the grouping of data (see Sorting table data below), the displayed graph or chart can show data gathered Monthly, Weekly, or Daily. If this option is available it will be at the top right, under the Export as button.
Visual display format
You can choose how the data will be visually represented by clicking one of the display options at top-right. Click to see it as a bar chart, or to view it as a line graph.

Text Search
Anything entered in the Search box below the graph will be matched against data in any of the available table columns (whether those columns are displayed or not).

Date range
Click the calendar icon ![]() in the Date Range box and select from the left side of the popup to view data in the following increments: Yesterday, Last 7 days, Last 30 days, This month, or Last month. Or use the calendar displays in the popup to choose the start and end date of any period within the last 90 days.
in the Date Range box and select from the left side of the popup to view data in the following increments: Yesterday, Last 7 days, Last 30 days, This month, or Last month. Or use the calendar displays in the popup to choose the start and end date of any period within the last 90 days.
Edit columns
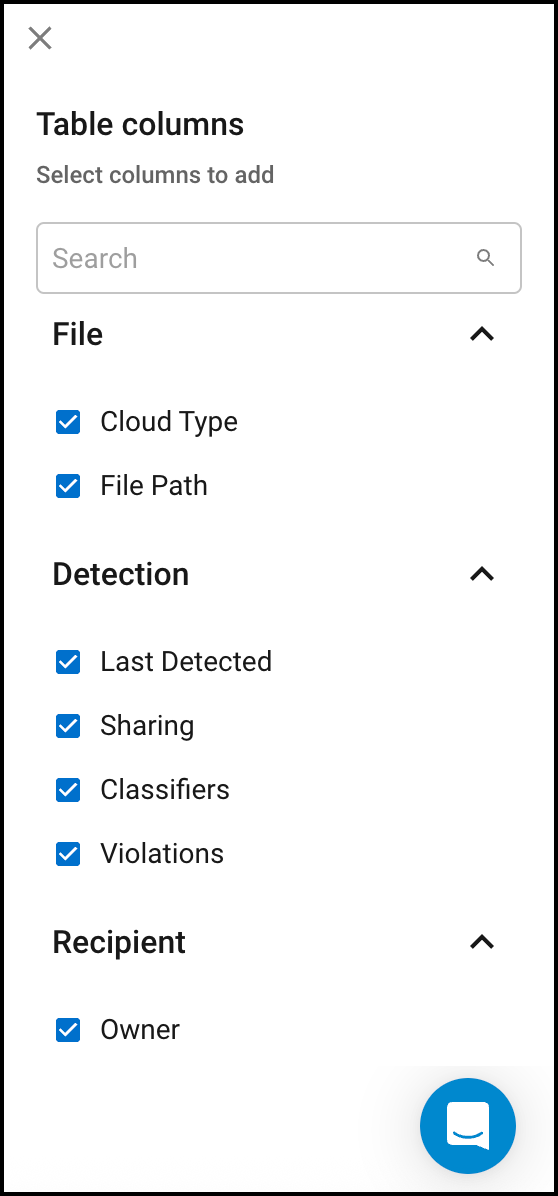
Click the Edit columns button to select or deselect the columns to display in the table below the graph. A flyout appears on the right side of the screen. Check or uncheck boxes to make your selections. Enter a column name in the search box to quickly find or limit column options.
Sorting table data
The table and graph data can also be sorted by clicking on or dragging some of the table column titles.
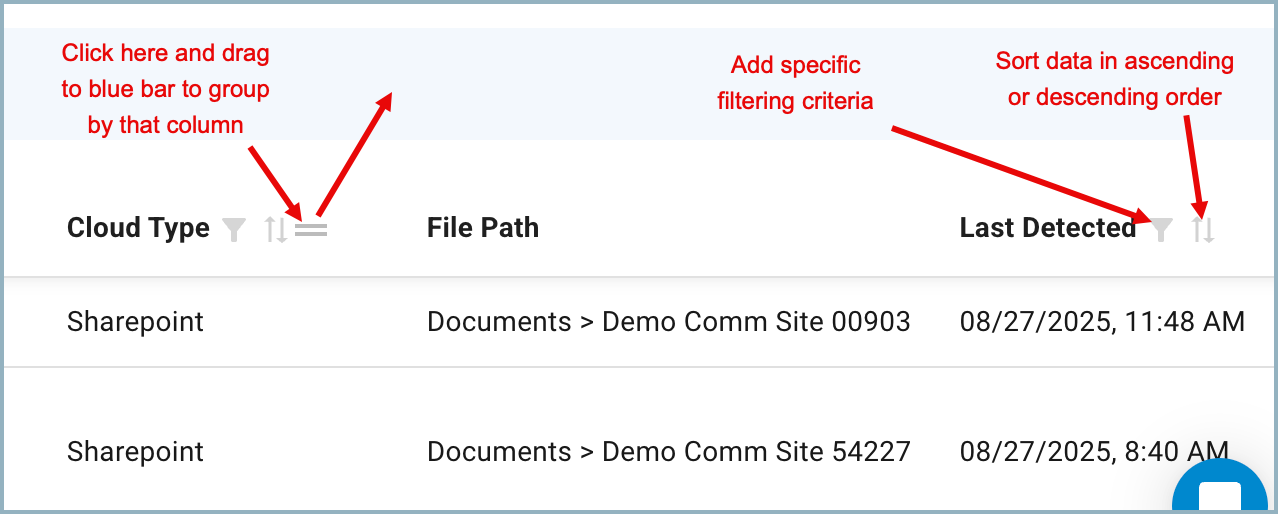
The double arrows icon ![]() shows that you can sort by this column in ascending or descending order. The single up or down arrow signifies that the displayed table data is sorted by this column.
shows that you can sort by this column in ascending or descending order. The single up or down arrow signifies that the displayed table data is sorted by this column.
(Example: clicking the arrows next to the File Name column header will display the rows by the alphabetical order of the file names detected. Clicking the Up arrow reverses the order.)
Clicking the funnel icon  will bring up a model allowing you to further define your filtering criteria. The image below is for the File Extension column. It shows a Condition dropdown list and a field to add a value.
(Example: Condition = does not contain , value = xls This will remove any file with an extension containing xls from the displayed results, like thisfile.xlsx)
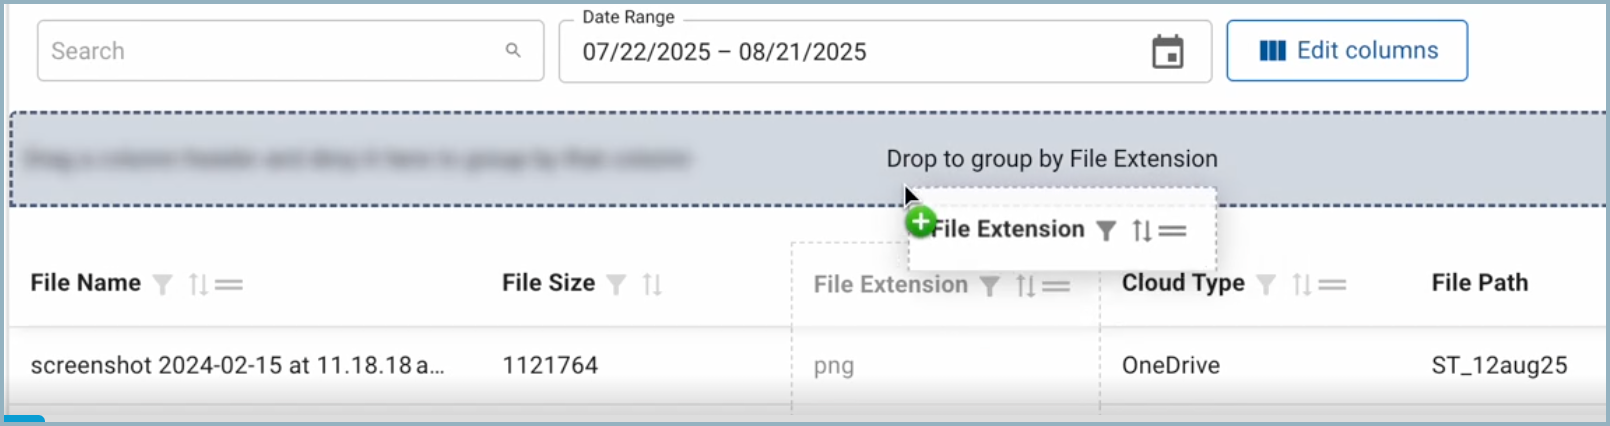
The two horizontal lines icon  can be clicked on and drug up to the blue bar immediately above it. (When the bar is empty, it shows “Drag a column header and drop it here to group by that column.”)
This image shows the icon to click on and drag.
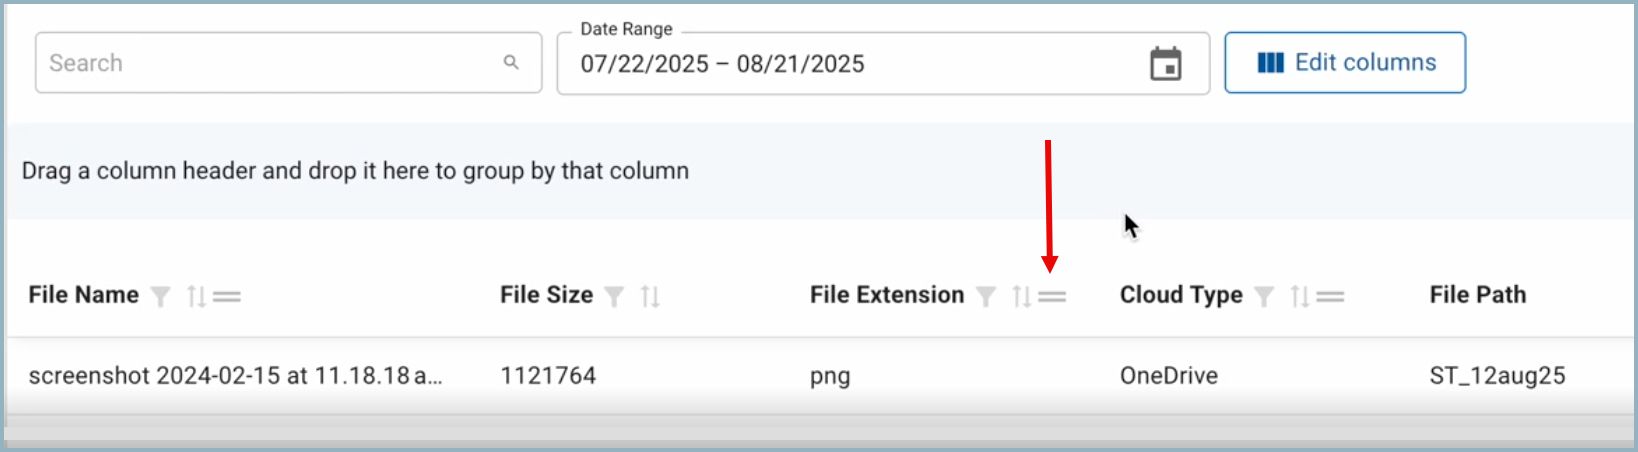
Then drag to the blue bar.
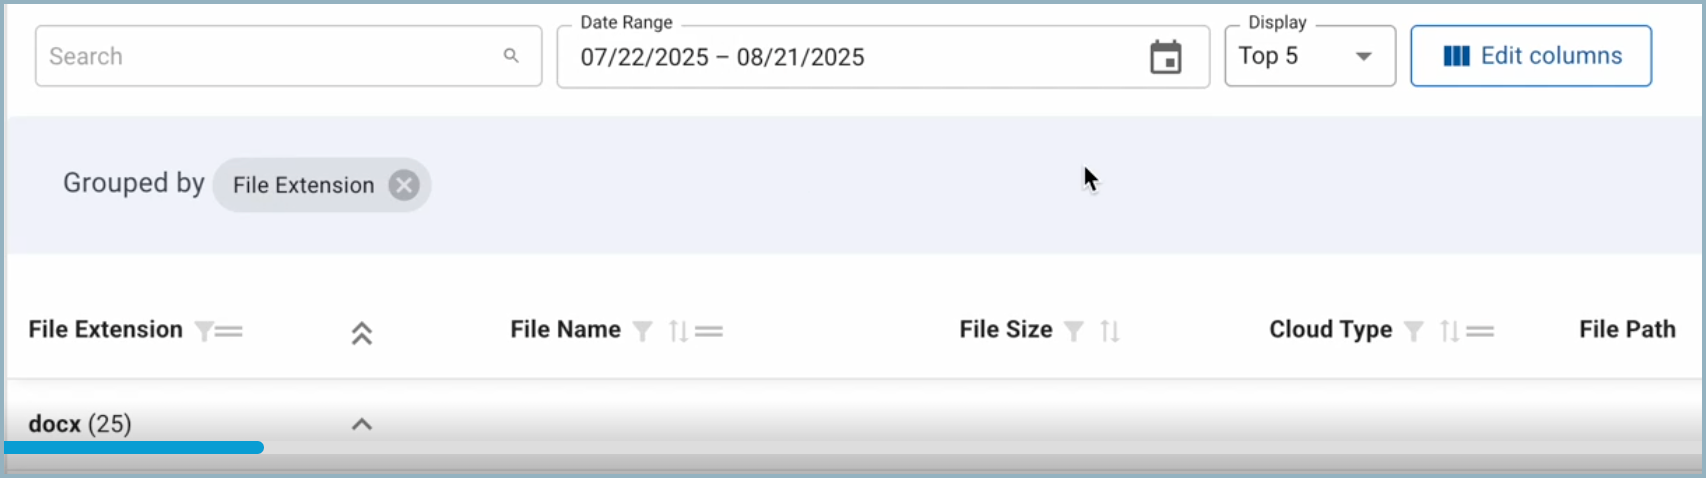
After dragging, the blue “grouped by” bar will look like this.
Up to two columns types can be added to the grouping bar. Items are grouped by the first column type and then within that grouping the second column type is grouped.
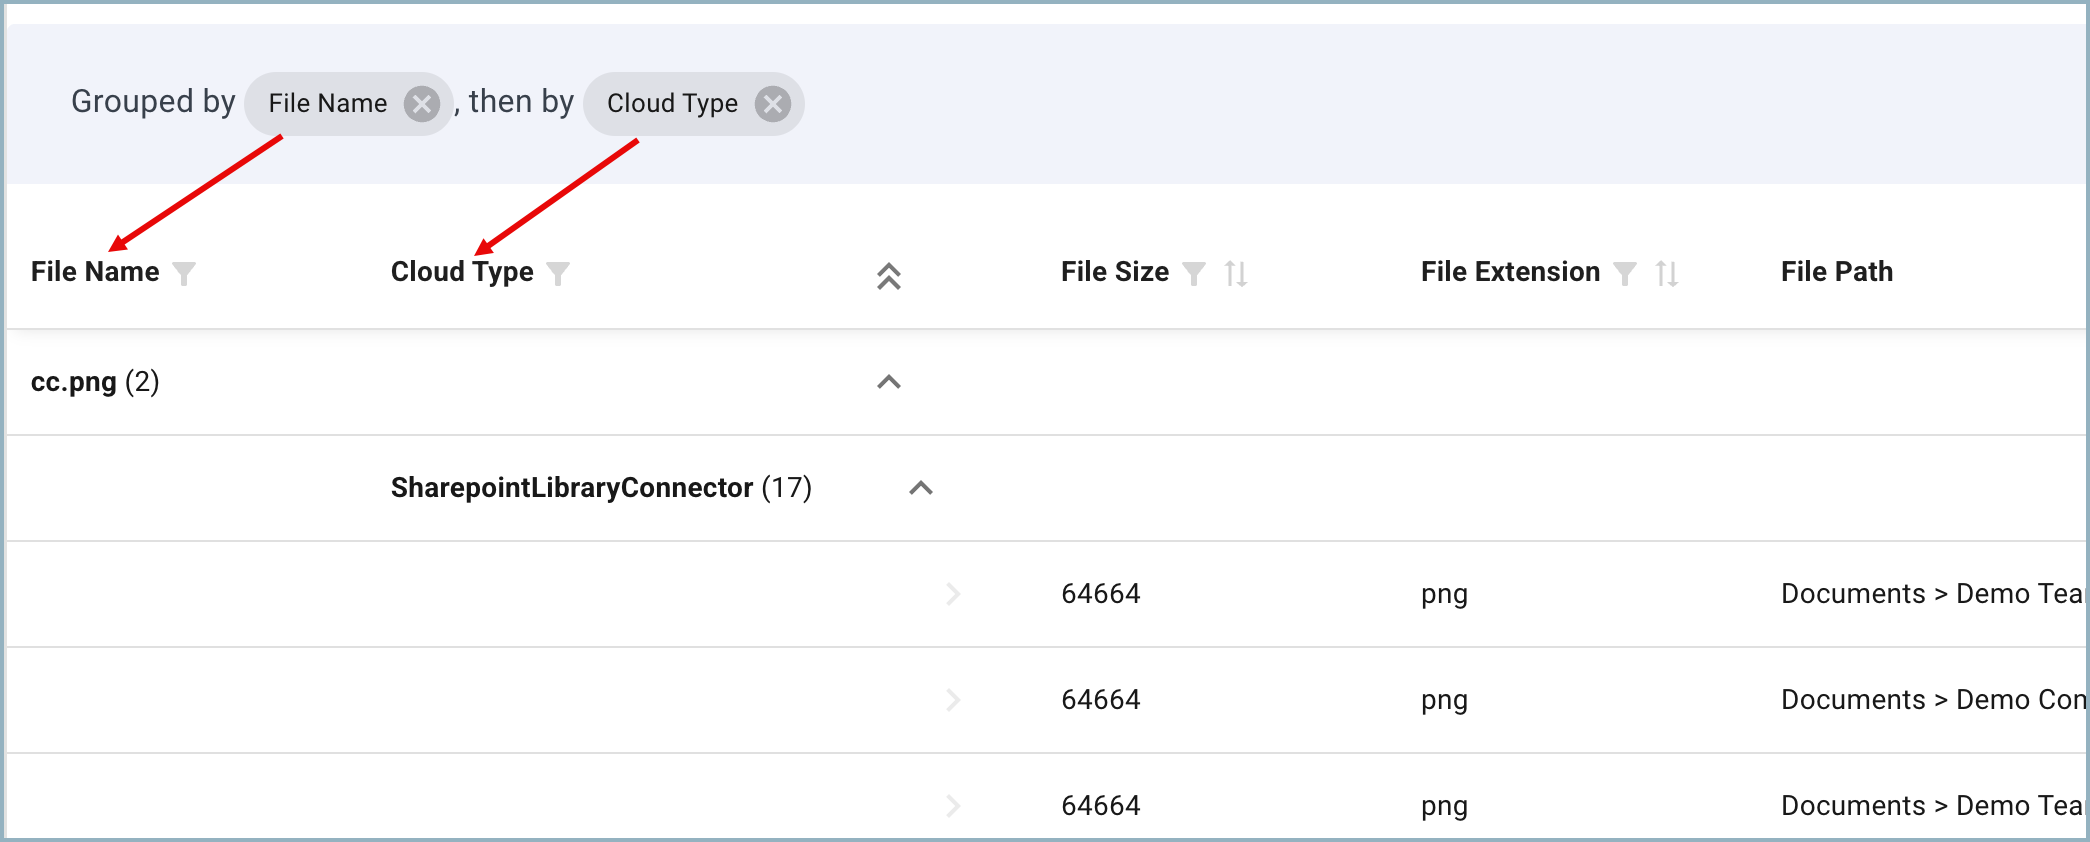
Table data columns
Classifiers – Categories of sensitive data detected in the file
Cloud Type – OneDrive or Sharepoint
File Extension – Shows only the file’s extension. Example: .pdf
File Name – The full name of each file
File Path – The file’s location
File Size – File size in bytes
Finding Categories – The category in which the violation was detected. Example: content
Last Detected – The last time a file was detected to be sensitive or malicious
Owner – The person or group that owns each file
Sharing – File sharing classifications are: Private, Protected, Public, External, Tenant and Internal
Violations – Number of times a violation was detected for a file
Saving a Customized Report
Once you have customized a report to show table and graph data to your liking, click the Save as button at top right. Then in the popup box, enter a name and click Save. Your new report can be found under My reports in the left side navigation. Clicking on the pin icon  will make that your default report and it will be displayed each time you return to Data Inspector Reports.
Other Report Features
Export
Click Export as and then select Download as CSV to export all data available in the table columns in CSV (Comma Separated Value) format. Note: the maximum number of lines that can be exported is 10,000.
Default Report
To set a default report, click on a report in the left navigation. This can be the built-in Barracuda Report or a report that has been customized and saved. Once highlighted, click again on the pin icon to make that the default report. Afterwards, whenever you return to Data Inspector Reports, it will automatically be displayed.