There are nine built in reports listed under Barracuda Reports that can be manipulated by setting column filters or choosing what and how data will be displayed. Once to your liking, they can also be named and saved for future use. These customized reports can be found under My Reports.
Insights from these reports can allow you to quickly understand the inbound and outbound traffic summaries, including a breakdown of blocked senders and recipients by type.
Report data is real time, meaning it is constantly updated with the latest information.
Barracuda's Built In Reports
Found under Reports > Barracuda Reports in the left navigation, these reports are designed to provide robust information about inbound and outbound mail in your organization.
The following report types do not support switching between inbound and outbound email flow: Inbound blocked emails breakdown, Top inbound email recipients, and Top inbound blocked recipients breakdown.
Inbound traffic summary
Number of inbound emails, sorted by email determination (deferred, blocked, quarantined, allowed).
Outbound traffic summary
Number of outbound emails, sorted by email determination (deferred, blocked, quarantined, allowed).
Inbound blocked emails breakdown
Number of inbound emails that have been blocked, sorted by reason (rate control, policy, spam, virus, ATP, other).
Top inbound email senders
Top inbound email senders and number of emails, sorted by email determination (deferred, blocked, quarantined, allowed).
Top inbound email recipients
Top inbound email recipients and number of emails, sorted by email determination (deferred, blocked, quarantined, allowed).
Top inbound blocked senders inbound breakdown
Top inbound senders that have been blocked and number of emails, sorted by reason (rate control, policy, spam, virus, ATP, other).
Top inbound blocked recipients breakdown
Top inbound recipients that have been blocked and number of emails, sorted by reason (rate control, policy, spam, virus, ATP, other).
Top outbound email senders
Top outbound email senders and number of emails, sorted by email determination (deferred, blocked, quarantined, or allowed).
Top outbound blocked senders
Top outbound senders that have been blocked and number of emails, sorted by reason (rate control, policy, spam, virus, ATP, other).
Customize Reports
Each report can be customized in various ways. Once a report is to your liking, you can name and save it for future use. The new report is then found in the left navigation under My Reports. Once saved, new data is displayed matching your customization.
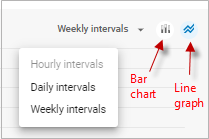
Time format – The displayed graph or chart can show data gathered Hourly, Daily, or Weekly. If this option is available, it will be at the top right, under the Save as button. Intervals are available depending on the date range selected. For example, Hourly intervals is only an option for daily and 24 hour date range, and Weekly intervals is available for monthly date range.

Visual display format – If available with the report type, you can choose how the data will be visually represented. Click the desired option to see it as a bar chart or a line graph. Note that some reports will not have both options available.
Text search – Anything entered in the Search box below the graph will be matched against data in any of the available table columns (whether those columns are displayed or not). Note that some reports will have the search option disabled due to the report content and details.

Date range – Click the calendar icon ![]() and select from the left side of the popup to view data from the Last day, Last 7 days, or Last 30 days. Or use the calendar displays in the popup to choose the start and end date of any period in the last 30 days.
and select from the left side of the popup to view data from the Last day, Last 7 days, or Last 30 days. Or use the calendar displays in the popup to choose the start and end date of any period in the last 30 days.
Domain – View data from All domains or select one or more from the list of your domains.
Email flow – View data from either Inbound or Outbound emails.
Top number – The Display dropdown is available for reports showing "Top" metrics. Limit the data in the chart by selecting Top 3, Top 5, Top 10, Top 15, Top 25, or Top 50.
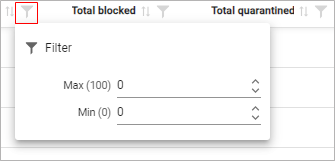
Column filtering – You can also add filtering to individual columns. Click on the filter icon ![]() to see and use filter options. Note that outbound report types have an extra column for Total encrypted count.
to see and use filter options. Note that outbound report types have an extra column for Total encrypted count.

Saving a Customized Report
Once you have customized a report to show table and graph data to your liking, click the Save as button at top right. Then in the popup box, enter a name and click Save. Your new report can be found under My Reports in the left side navigation. Clicking on the pin icon will make that your default report and it will be displayed each time you return to Reports.
Other Report Features
Export – Click Export as and then select Download as CSV to export all data available in the table columns in CSV (Comma Separated Value) format.
Set a default report – Click on a report in the left navigation. Once highlighted, click again on the pin icon ![]() to make that the default report. Afterwards, whenever you return to the Reports page, it will automatically be displayed. It can be one of the built in Barracuda Reports or one you have customized and saved in My Reports.
to make that the default report. Afterwards, whenever you return to the Reports page, it will automatically be displayed. It can be one of the built in Barracuda Reports or one you have customized and saved in My Reports.
