

The Dashboard tab and child pages provide aggregated data on SD-WAN, SD-WAN tunnels, network traffic, and security information. Use various filters, as described below, to get the specific data you need.
Accessing Information on the Dashboard
To access information on the Firewall Insights Dashboard, click the corresponding tab:
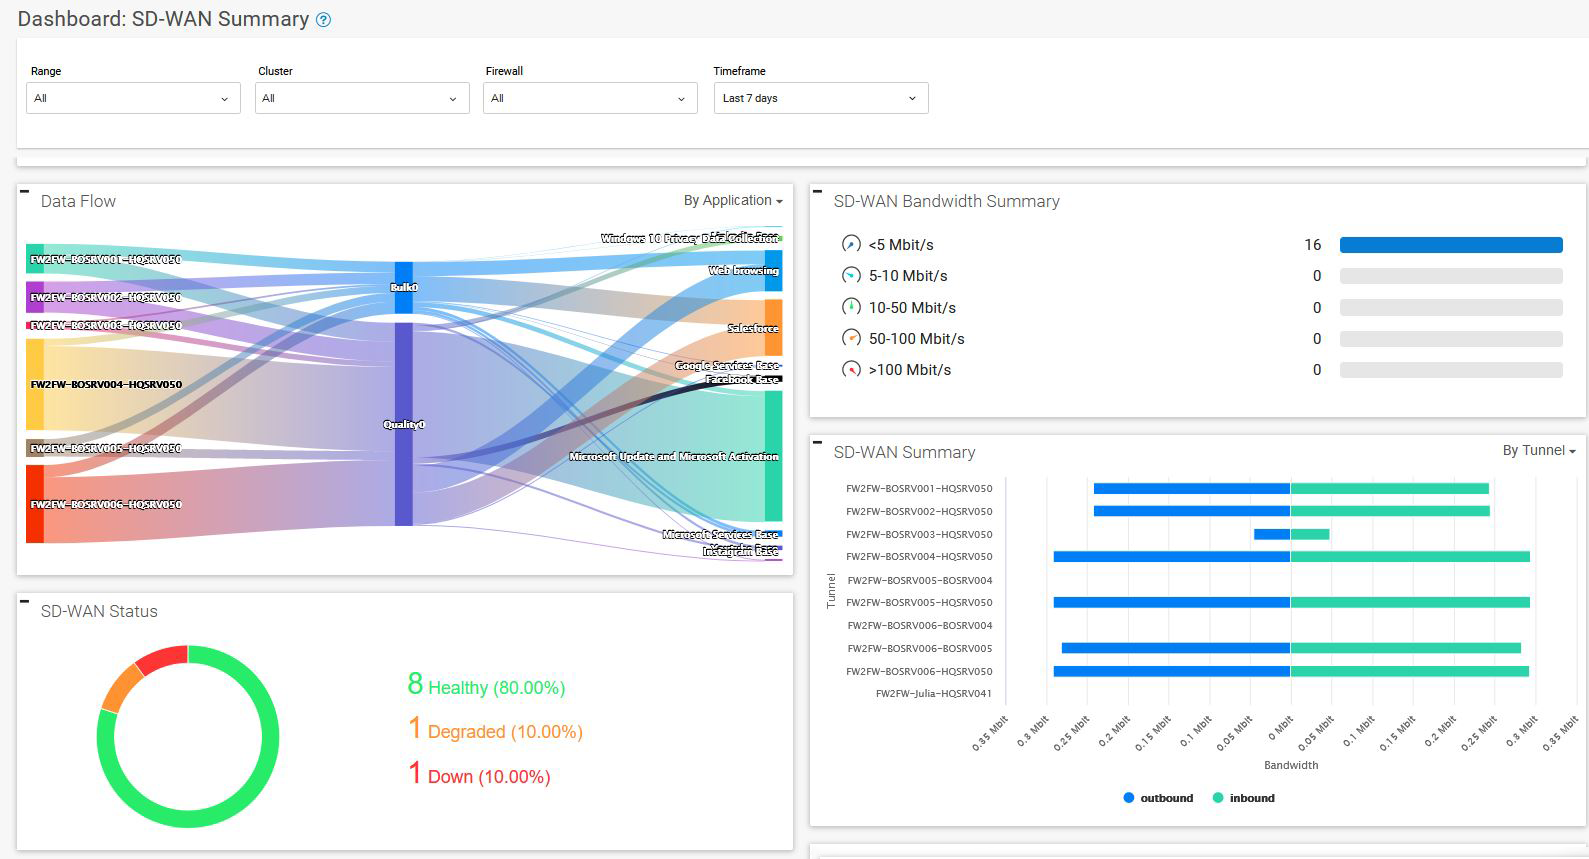
SD-WAN Summary
Go to Dashboard > SD-WAN Summary.
SD-WAN Tunnels
Go to Dashboard > SD-WAN Tunnels.
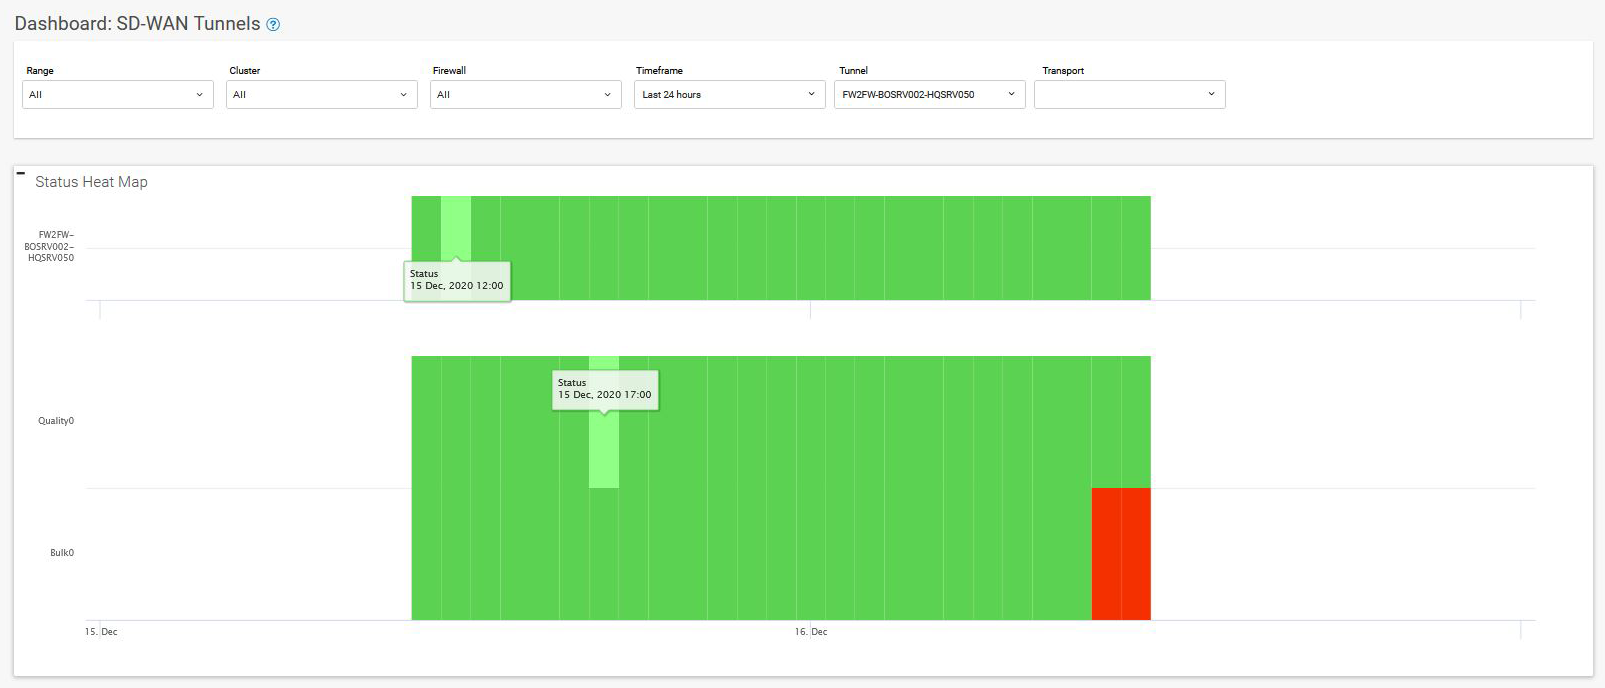
To view the status of SD-WAN tunnels for a selected period of time, use the filters above the graph. The SD-WAN tunnel status is indicated by different colors:
- Green – More than 50% online during the time span.
- Red – More than 50% offline during the time span.
- White – Firewall has not sent any data during the time span.
The time span displayed in the graph depends on the scope selected on the dashboard. The status can therefore also change when the time span is changed.
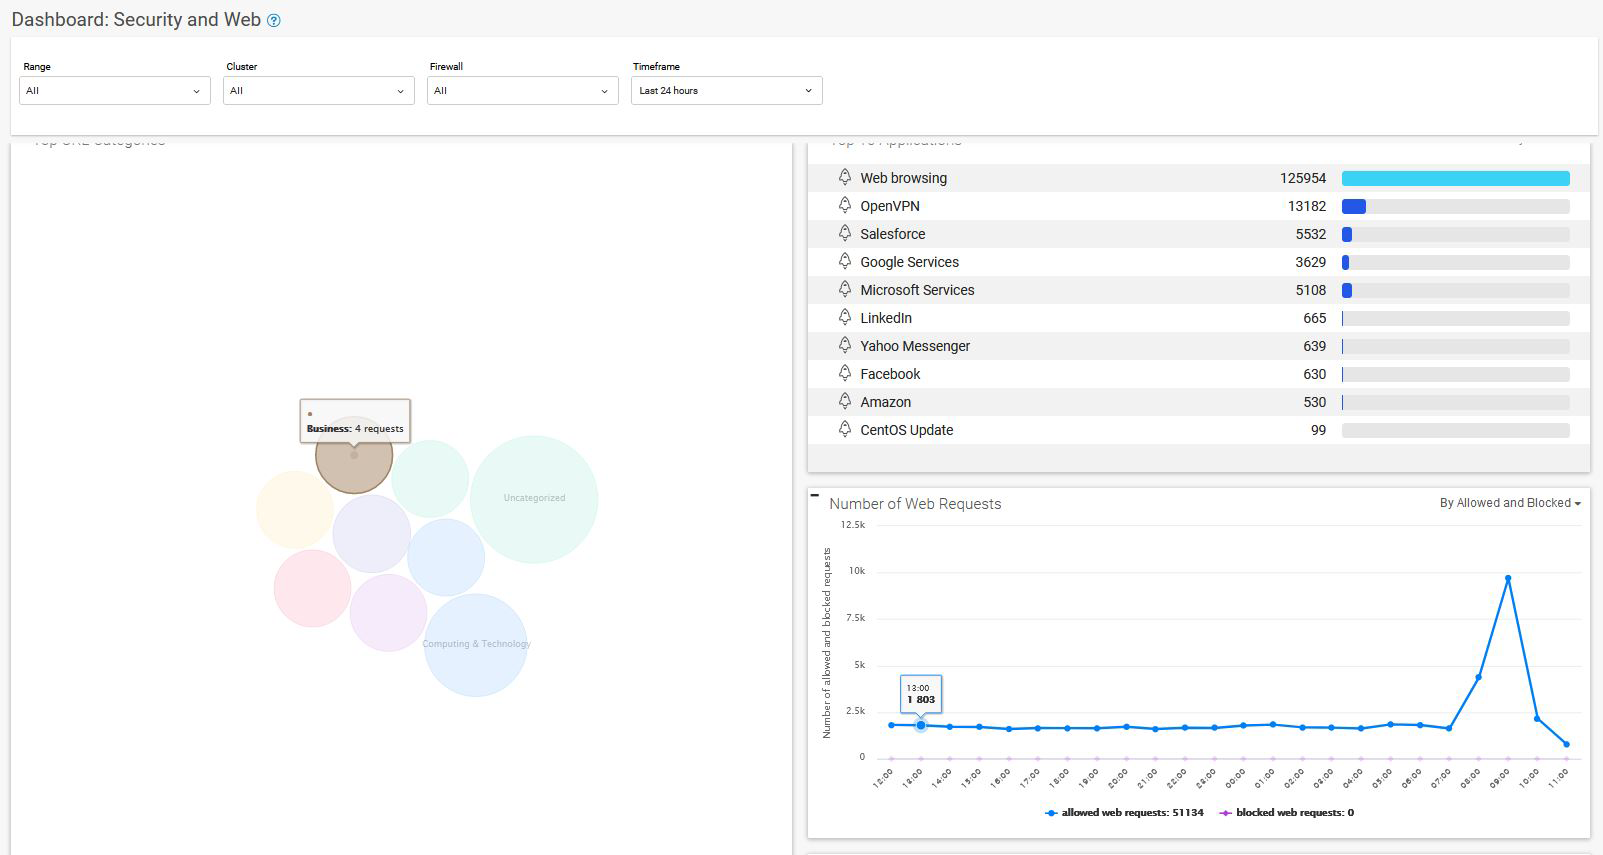
Security and Web
Go to Dashboard > Security and Web.
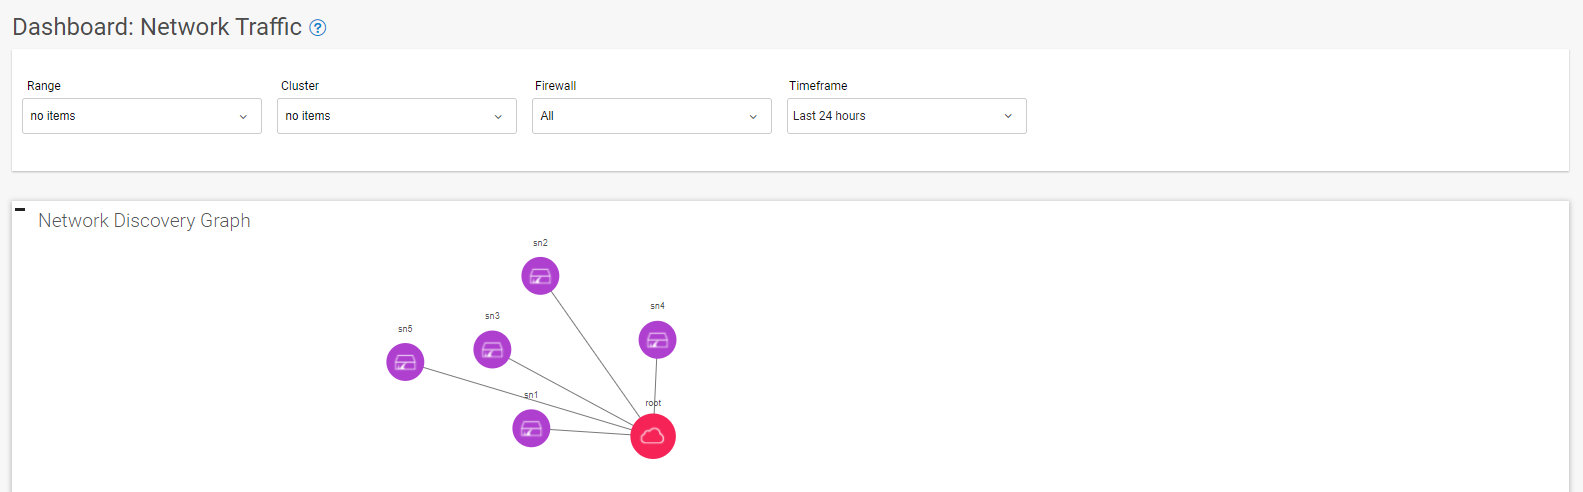
Network Traffic
Go to Dashboard > Network Traffic.
Display Information Using Filters
For the SD-WAN Summary, Security and Web, and Network Traffic tabs, you can select the following filters: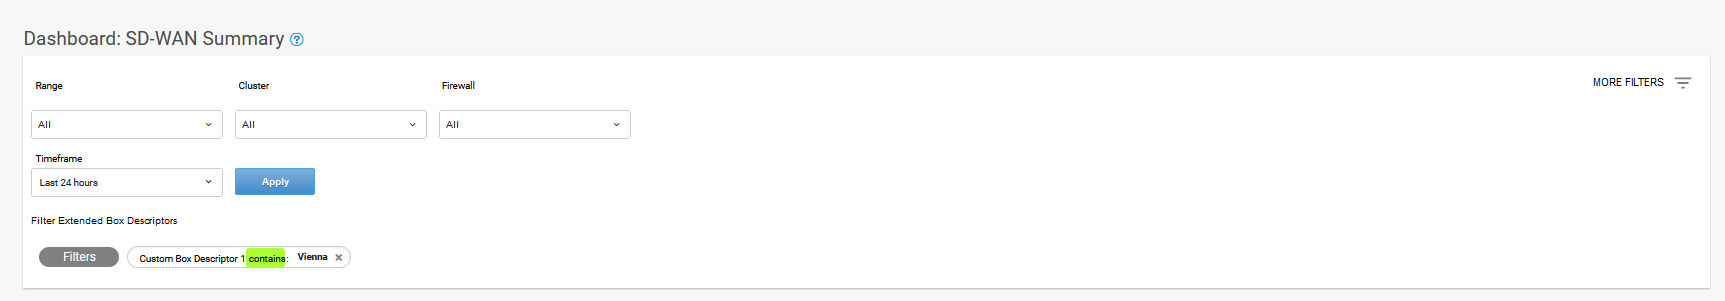
- Range – Select the range where the CloudGen Firewall devices you want data on are located.
- Cluster – Select the cluster where the CloudGen Firewall devices you want data on are located.
Firewall – Select the CloudGen Firewall devices you want data on.
- Timeframe – Choose a time frame from the drop-down menu to specify the time frame you want to show the data for.
If configured, additional filtering criteria, such as country, state, and location, will be available for selection. To filter for extended box descriptors, click MORE FILTERS in the top-right corner and use the additional filters to narrow down your selection. Extended box descriptors must be configured on the respective firewall to show this filtering function. For more information, see How to Configure Custom Box Descriptors and Filter Managed Firewalls in Different Data Views in the CloudGen Firewall documentation.
For the SD-WAN Tunnels tab, you can select the filters described above and the additional filters below: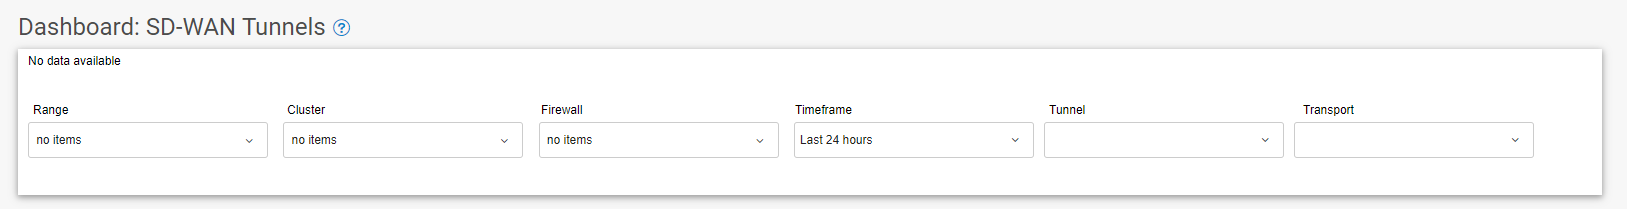
- Tunnel – Select the tunnel you want to show the data of.
- Transport – Select the transport you want to show the data of.
The information is displayed for the filters you set.