

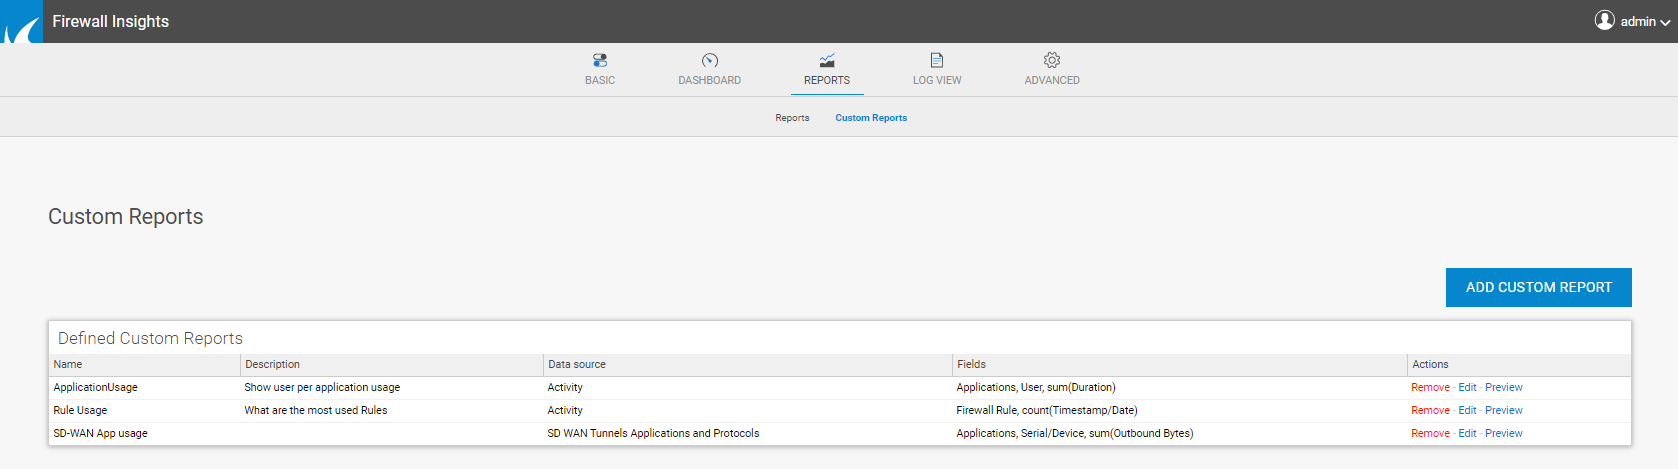
With Barracuda Firewall Insights, you can generate custom reports for allowed or blocked traffic as well as for SD-WAN data by common criteria such as protocol, user, source, and risk.
Before You Begin
- For a description of the Reports page of your Barracuda Firewall Insights, see Reports.
- To store your reports on an external server, you must first configure an external SMB or FTP server. For more information, see External Servers.
- To learn more about time frames and recurring reports, see Understanding Time Frames and Recurring Reports.
Create a Custom Report
To configure a custom report, choose a data source and add your custom filtering criteria.
Step 1. Add a Custom Report
- Go to REPORTS.
- Click Add Custom Reports. The New Custom Report window opens.
Enter a Name for the report. Only alphanumeric characters are allowed.
Enter a Description.
Select the Data Source.
- Activity – Create a summary of activities (firewall activity log) for a specific user or source IP address.
- Threat – Use this type to create reports for detected threats (firewall threat log) that have been blocked by common criteria such as protocol, severity, source, and risk.
- Webfilter – Create reports related to web activity.
- SD-WAN Tunnels – Create a summary of SD-WAN tunnels and traffic details.
- Applications and Protocols – Create reports summarizing the usage of specific applications and protocols.
To generate a preview of the data, use the Log View to access and filter it. For more information, see Log View.
Step 2. Configure Report Data Settings
For each selected data source, chose the data fields you wish to include in the report. You must select at least one field category. The configurable fields change automatically as soon as you select a different data source. (See filters below for example configurations.)
- Under Select fields, click the plus sign (+).
From the Choose column drop-down list, select the data field you wish to add to the custom report in order to show that data. Fill in the fields without functions first and then the fields with functions.
For example:- Applications / Protocols / Rules – Choose this selection for the usage of specific applications, protocols, or application rules that should apply to the data generated by your report.
- Contents – Choose content that appears in the data generated by your report.
- Destination / IP / ... – Choose for destination criteria of traffic generated by connected devices.
- Firewall Rules – Set a selection for access rules that apply to the traffic the report is generated for.
- If a selected data field requires an additional selection entry and shows a No function drop-down menu, then a function must be selected, e.g., for received bytes, etc.
Expand the No function drop-down menu and select one of the following functions:- Count – Counting how many lines.
- Sum – The numerical value of this field is added up for all entries.
- take average – Average value, i.e., sum / count.
- take maximum / minimum – Maximum or minimum value of this field
- To configure number values for a selection, e.g., destination port in the activity log, use functions. To set filter criteria for the data to search for, define values to narrow down the search result, e.g., for a specific user. You must add a filter for each data field added in Step 2.2. To add a data field, click the plus sign (+) and select the filter criteria for that data:
- For more complex links, you can use parentheses in parentheses for each filter: In the first field, you must insert opening parentheses "
(" and in the last field closing parentheses ")". - Use is equal, not equal, contains, not contains for string / text fields, or is equal, not equal, greater, smaller for number fields as the comparison operator. Enter the desired value in the subsequent field.
To set filters, combine them using AND / OR operators.
- For more complex links, you can use parentheses in parentheses for each filter: In the first field, you must insert opening parentheses "
- (optional) Use Select Group by to group entries generated by the report. If not configured, the selected fields are displayed as a table.
From the column, chose which criteria you wish to group the entries by in your custom report. You can combine several selections by clicking the plus sign (+) after choosing a selection.
- Click OK.
If everything is entered correctly in the form validation, the report is created and appears in the Custom Reports list. You can now edit the report and make changes, e.g., schedule the report, etc. The preview will contain a time span of one day.
Example Configurations
The following examples generate custom reports using different filtering criteria.
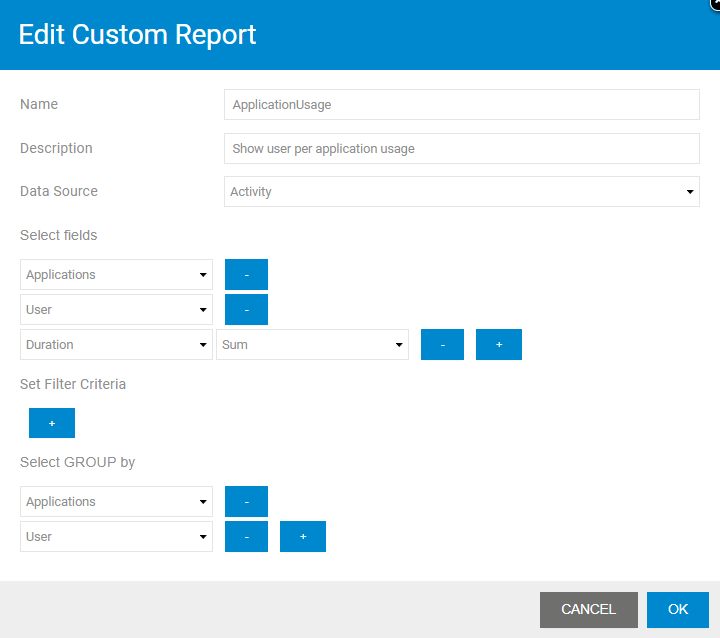
Example 1. Application Usage
This configuration generates a custom report for user per application usage. The filter is set for applications, user, and overall duration.
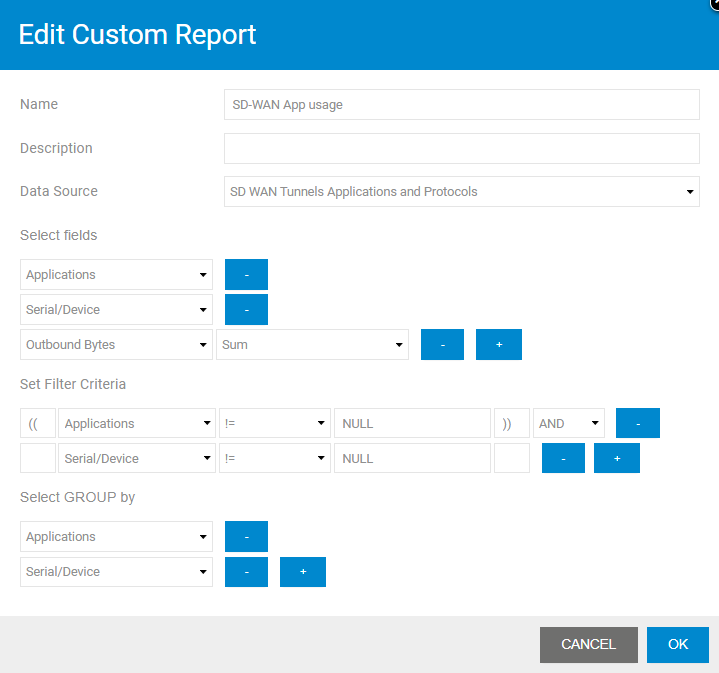
Example 2. SD-WAN App Usage
This configuration generates a custom report for SD-WAN tunnel traffic according to usage of applications and ports. The filter is set for applications, device serial, and traffic load.
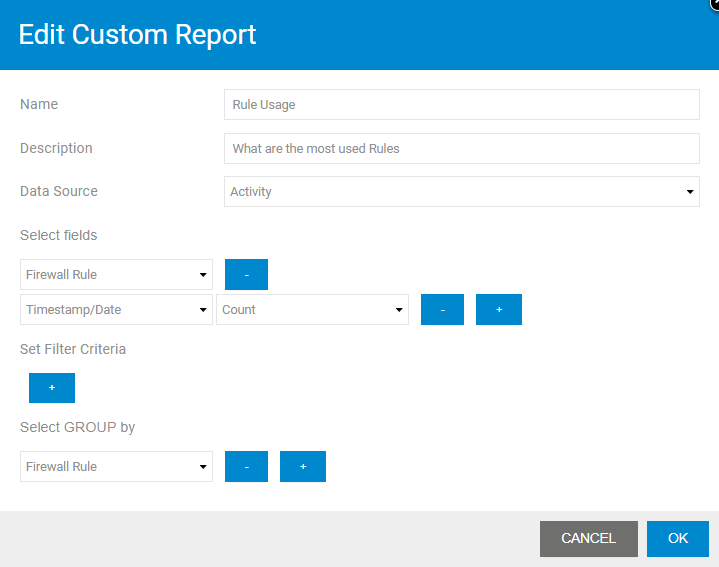
Example 3. Access Rule Usage
This configuration generates a custom report for access rule usage. The filter is set for rule and time stamp.
Further Information
- For field descriptions of custom reports on Barracuda Firewall Insights, see Custom Reports - Field Descriptions.