

On the basic monitoring pages you can access information about system performance and traffic throughput of your Barracuda Link Balancer.
Status Overview
The Basic > Status page provides an overview of health and performance of your Barracuda Link Balancer, including utilization and status of links, the subscription status of Energize Updates and system and hardware statistics including CPU temperature and system load. Performance statistics display in red to signify that the value exceeds the normal threshold.
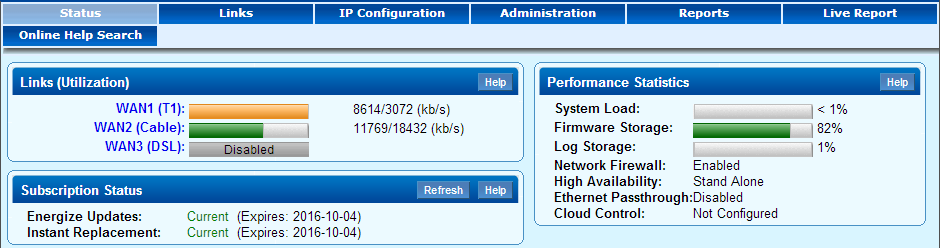
The Status page shows incoming and outgoing traffic statistics for each WAN link. You can also view WAN link utilization and connection status by scrolling over the WAN port graphic on the BASIC > Links page. View the status of VPN tunnels on the SERVICES > VPN page.
Live Report
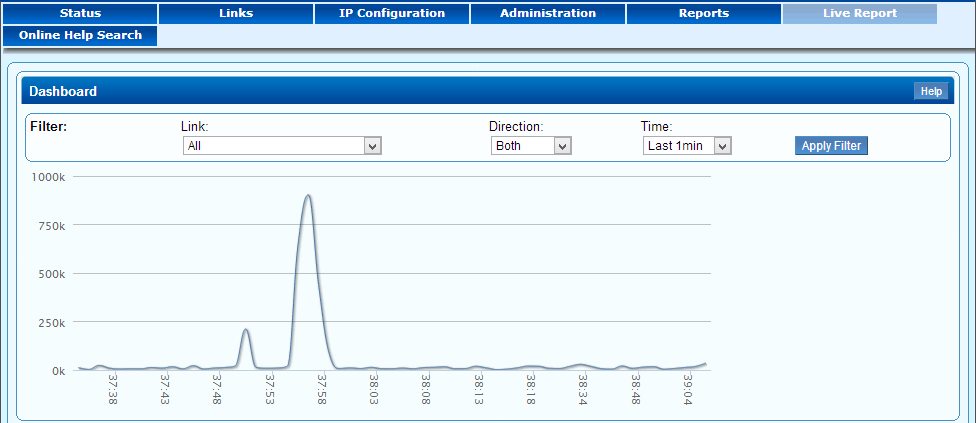
To view real-time traffic throughput on your Barracuda Link Balancer, go to the BASIC > Live Report page. The Dashboard section displays live traffic throughput. By default, it shows all traffic passing through the WAN ports in each direction. You can filter this information by Link, Direction, or Time.
The Top Ten Users section limits the displayed real-time data to the top ten IP addresses. By default, data reflecting all WAN ports within the last 30 seconds is displayed. You can filter this data by Link and Time.
The Top Ten Application section limits the displayed real-time data to the top ten applications. By default, data reflecting all WAN ports within the last 30 seconds is displayed. You can filter this data by Link and Time. Only the following applications are displayed in the Top Ten Application diagram:
- HTTP
- FTP
- SSH
- Telnet
- SIP
- Skype
- BitTorrent
- Kazaa
- AIM
- MSN Messenger
More applications are known and available on the POLICY > Bandwidth Mgmt page in the Quality of Service section.