

In addition to the myriad reports included with Security Awareness Training, you can create your own custom reports to see exactly the data you want to analyze in the way you want it presented.
Sorting
Before you begin, it is helpful to understand sorting within Custom Reports.
You can choose to sort your Custom Report by these fields. Each of these fields is described below and is marked with a ‡ to indicate you can add sorting.
- Summary Levels #1-3
- Summary Fields
- Email Address Meta Data Fields
For each of these fields, you can specify:
- Sort Priority – Select the sort order. Sort Priority of 1 sorts first, Sort Priority of 100 sorts last.
- Sort Direction – Select ascending (0-10 or a-z) or descending (10-1 or z-a) order.
Tip: Consider spacing your Sort Priority values by tens (10, 20, 30...), so if you decide to insert another field, you do not have to go back and renumber.
Sort Priority and Sort Direction are currently ignored if Summary Totals is enabled below. With Summary Totals enabled, report is sorted by columns ascending in left to right order.
Creating a Custom Report
To create a custom report:
- From the Results menu, select one of the following entries or select Campaigns > Address Books.
Event Points Analysis
Inbox Analysis
Incident Response Dashboard
Outbound Analysis
Web Activity Analysis
- At the top of the page, click Custom Reporting.
- In the Custom Report Designer, click New.
- Complete the following information:
General Settings- Custom Report Name – Provide a familiar name for the custom report.
- Display Options – Specify if you want to display a chart, table, both, or nothing (hidden).
- Custom Report Description – Optional. Provide a description of this report.
- ‡Summary Levels #1-3 – Specify up to three levels by which to group and subtotal results data. The levels are hierarchical. For example, you can see the Average Click Rate by Organizational Area, then by a specific Manager.
See note about sorting below. Cross Tabulation – Optional. Specify a further level of breakdown for the results data.
Select up to five additional email-related fields to add to your custom report. As noted above, you must set Summary Level 1 to Email Address to use these Email Address Metadata fields.
‡Summary Fields
- Add up to five Summary Fields, describing the results you want to calculate, specifying the mathematical information for each field.
- Here is an example showing the average click rate of emails, as a percentage of all emails sent.
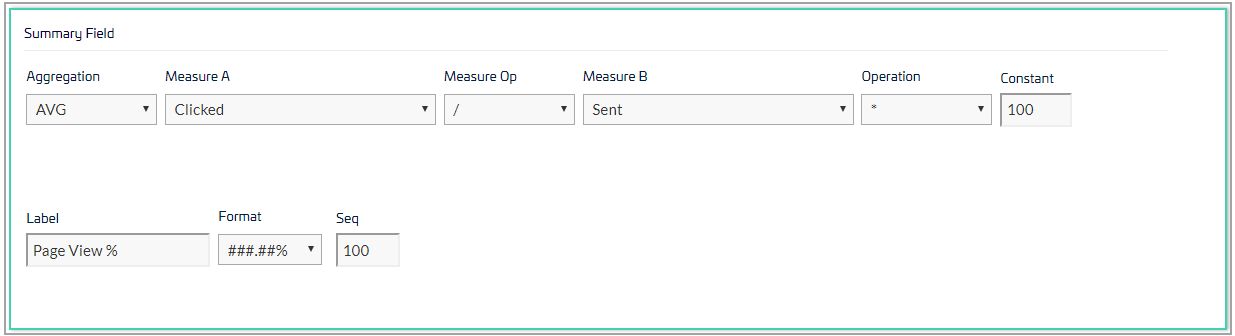
- Aggregation – Select a function. Choose from: SUM, AVG, COUNT, MAX, MIN, STD, YES/NO.
- Measure A – Select a result type for your equation, like Clicked or Bounced.
- Measure Op – Select the first operator for your equation.
- Measure B – Select the second result type for your equation, if any, like Sent or Send Attempt.
- Operation – Select the second operator for your equation, if any.
- Constant – Specify a constant, if any, such as multiplying by 100 to calculate a percentage.
- Label – Specify a custom label for this value.
- Format – Select how you want to view the value.
- Seq – Specify the sequential order for the summary fields to display.
Chart Options
- Specify the visual properties for how you want to display the results data.
- Chart Title – Specify a title for the chart.
- Chart Subtitle – Optional. Add a secondary title to display on the chart.
- Chart Type – Select the type of chart to visually represent the data. (For example, select from bar, column, and line charts.)
- Chart Size – The dimensions of the chart, width x height, in pixels.
- Hide Zero Values – Choose whether to display values of 0 or hide them.
- Show Sums – Choose whether to display sums of stacked values in a chart.
- Show Values – Choose whether to display the numerical values next to the specified chart element.
- Show Legend – Choose whether to display a legend. This is helpful when there is more than one summary field in one chart.
- X-Axis Label – Optionally type a label for the horizontal axis of your chart.
- Y-Axis Label – Optionally type a label for the horizontal axis of your chart.
- Adaptive Y-Axis Minimum Value – Select this value if you only want to see a specific section of the vertical axis of your chart.
- Y-Axis Minimum Value – Specify the lower limit of the vertical axis of your chart.
- Y-Axis Maximum Value – Specify the upper limit of the vertical axis of your chart.
- Pie Chart Radius – If you are creating a Pie or Doughnut Chart, specify its radius, in pixels. To avoid cutting off the chart, be sure to keep the radius smaller than half of the length and width of the chart size.
Table Options
- ‡Summary Totals – Specify whether you want to display totals for each portion of the data, in addition to the grand total. (See Sorting section above.)
- Repeat Summary Labels – Specify whether you want to display labels for the Summary Totals (the field immediately above this field).
- Cross Tab Totals – For a Cross Tab report, specify whether you want to include totals for each measure.
- Cross Tab Measures First – For a Cross Tab report, specify whether you want to show the columns by measure, rather than by calculation.
- At the top of the page, click Save.
- Optionally click Preview to see what your results will look like.
- Based on your preview, make any adjustments as needed, then click Save again.
- Return to the page within results to see your new custom report.
Downloading a Custom Report
To download your custom report as a CSV:
- View the report.
- Click the download button
 .
.
The custom report downloads automatically.