

If your organization has installed the Phish Reporting Button, as described in Button Plugin Config, you can use this dashboard to view both simulation-based and real-life reports of phishing within the environment.
Note that when customizing the button, you must specify your organization's Security Awareness Training email address (phishline_<Instance_Name>@phishline-incident-response.com) in the Send To fields. Refer to the customization instructions for your type of reporting button, following the link above.
Disposition
Within the table, you can specify a disposition for the reported message, choosing from the following:
- Confirmed – User correctly reported questionable email.
- Under Review – Report is currently being investigated.
- False Positive – User reported an email as questionable, but the email was legitimate.
Charts
There are several preconfigured charts included with Incident Responses. The charts help you to see important information at a glance.
You can interact with these charts in the following ways:
- Use the filters in the Filter panel to specify which information to include in the charts.
- Hover over a section in the chart to see its details.
- Click part of a chart or label to drill down into that data. The charts will be redrawn, including only that information. For example, if you click a domain that emails were sent from, you can see when they were sent, the subjects of the messages, how the messages were dispatched, and so on. You can drill down multiple times, if you choose.
| Name/Description | Sample Image |
|---|---|
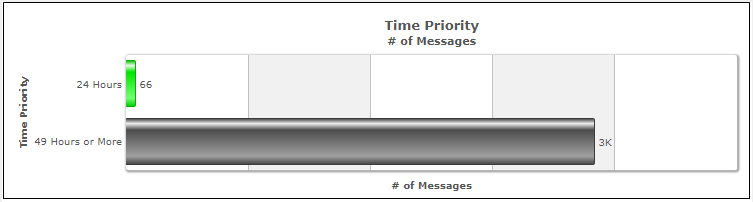
Time Priority
|  |
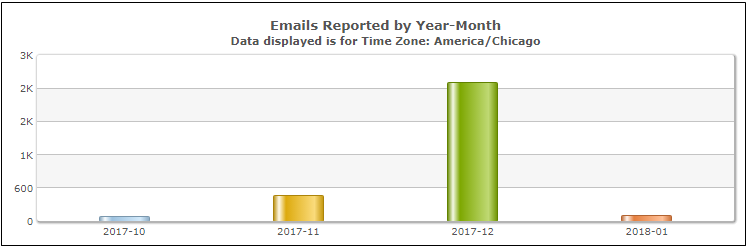
Emails Reported by Year-Month
|  |
Time Priority
- Bar Chart
- Displays Time Priority (the age of a message) by the number of messages in that category.
Emails Reported by Year-Month
- Bar Chart
- Displays number of emails reported by year for the time zone associated with the Security Awareness Training administrator.
Disposition
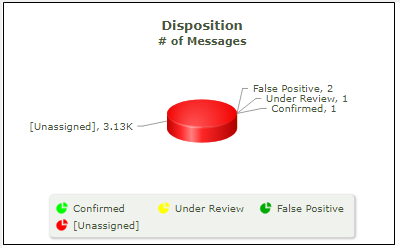
- Pie Chart
- Displays how reported messages were handled:
Confirmed,Under Review,False Positive,Unassigned.
Top 20 Original Subjects
- Bar Chart
- Displays subject line text of the 20 most popular messages and the number of messages with each of the subject lines.
Top 20 Original From
- Bar Chart
- Displays the sender of the 20 most popular messages and the number of messages from each of the senders.
Top 20 Original From Names
- Bar Chart
- Displays the familiar sender names for the 20 most popular messages and the number of messages from each of the senders.
Top 20 Original From Domains
- Bar Chart
- Displays the domains from which the 20 most popular messages were sent and the number of messages from each of the domains.
Top 20 Reporters
- Bar Chart
- Displays the top 20 individuals in your organization who reported the most potentially harmful phishing emails, and the number of messages each user reported.
Emails Reported by Year
- Bar Chart
- Displays the number of emails reported per year, for the time zone associated with the Security Awareness Training administrator.
Emails Reported by Year-Quarter
- Bar Chart
- Displays the number of emails reported in the last year, broken down by quarter, for the time zone associated with the Security Awareness Training administrator.
Emails Reported by Year-Month
- Bar Chart
- Displays the number of emails reported in the last year, broken down by month, for the time zone associated with the Security Awareness Training administrator.
Emails Reported by Year-Week
- Bar Chart
- Displays the number of emails reported in the last year, broken down by week, for the time zone associated with the Security Awareness Training administrator. Weeks of the year are numbered from 1-52.
Emails Reported by Year-Day of Week
- Bar Chart
- Displays the number of emails reported in the last year, broken down by day of the week, for the time zone associated with the Security Awareness Training administrator.
Emails Reported by Year-Hour of Day
- Bar Chart
- Displays the number of emails reported in the last year, broken down by hour of the day, for the time zone associated with the Security Awareness Training administrator. Hours of the day are numbered 1-24, with hour #1 starting at midnight.
Exporting Data
Anything in the Results tables can be exported as a PDF or CSV file. For details, refer to How to Export Data.
Creating Custom Reports
For details, refer to How to Create Custom Reports.
There are myriad ways to view incident response metrics. You can create many different custom reports based on the types of incident response metrics you want to evaluate.