

Each connected device type has its own dashboard.
These dashboards are separate from the main Barracuda Reporting Server dashboard.
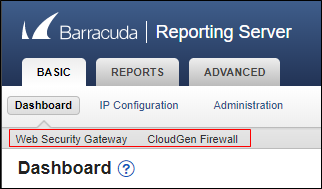
Device Type Selection
At the top of the screen, select the device-specific dashboard you want to view.
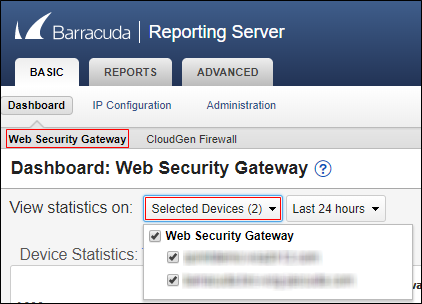
View Statistics On
This section is available for all types of devices.
You can set one or more connected devices for which you want the Dashboard to display reports.
At the top of the Dashboard page, make selections in the View statistics on area.
- In the first pull-down menu, select one or more connected devices for which you want to see reports.
Note that devices that are disconnected are still available here, since their data is still available. - In the second pull-down menu, select the time frame for the reports: Last 24 hours, Last 7 days, Last 30 days
By default, All Connected Devices are displayed, showing data from the Last 24 Hours.
Note: Device selection and time frame are remembered each time you open the Dashboard.
The following sections describe dashboard features for specific types of connected Barracuda Networks appliances. Click an appliance name to display its features.
Device Statistics
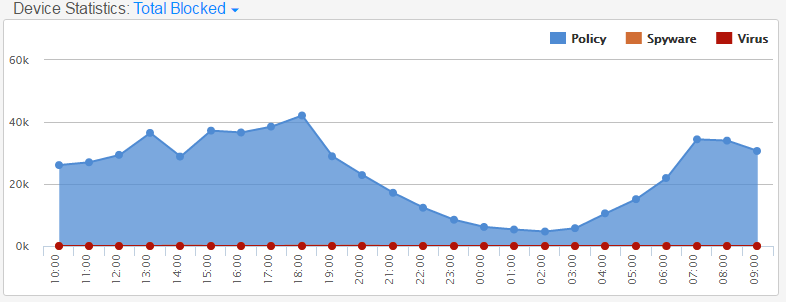
This graph can display a number of different statistics tied to the Barracuda Networks devices that are connected to the Barracuda Reporting Server. Select the graph you want to view from the following options:
- Total Blocked – (Default) Displays the number of policy, spyware, and virus blocks for the specified time period.
- Blocked Policy – Displays the number of policy blocks for the specified time period.
- Blocked Spyware – Displays the number of spyware blocks for the specified time period.
- Blocked Virus – Displays the number of virus blocks for the specified time period.
- Total Allowed – Displays the number or requests allowed to pass through the connected Barracuda Networks device for the specified time period.
You can also cycle through the various graphs by clicking the circles below the graph  . Each circle represents a different graph subject.
Recently Flagged Terms
This section lists the most recent flagged terms being tracked by the Barracuda Web Security Gateway when both SSL Inspection and Web Application Monitoring are enabled. If either one of these settings is not enabled, no data can be displayed in this section.
The following information is displayed in table form:
- Device Name – The name of the device you selected at the top of the page, in the Report On section.
- User – The name of the user making the requests.
- IP Address – The IP address of the user.
- Source – The domain in which the flagged terms were used.
- Keywords – The word or phrase that was flagged.
- Time – The time the flagged term was used, in local time, according to your configuration.
Note: If no flagged terms are available, ensure that the following two settings are enabled on your connected Barracuda Web Security Gateways.
- SSL Inspection
- Web Application Monitoring
If either one of these settings is not enabled, no data can be displayed in this section.
Productivity
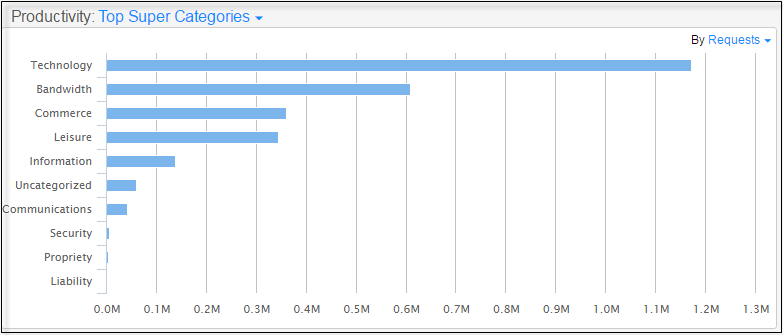
Select to display a graph of the Top Super Categories (default), Top Categories, Top Users, or Top Domains from the drop-down menu on the top left. Adjust the units to display by Requests, Bandwidth, or Browsing Time with the drop-down menu on the top right.
Web Activity
Select to display a graph of total web activity in Bandwidth (default) or Requests as measured by the Barracuda Web Security Gateway.
HTTP traffic is the difference between Total Traffic and HTTPS Traffic shown on the graph.
Firewall Statistics
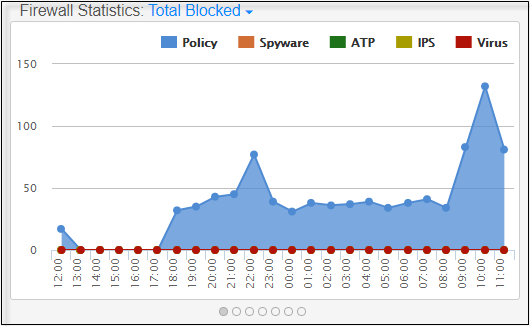
This graph can display a number of different statistics tied to the Barracuda Networks devices that are connected to the Barracuda Reporting Server. Select the graph you want to view from the following options:
- Total Blocked – (Default) Displays the number of all blocks described below for the specified time period.
- Total Allowed – Displays the number or requests allowed to pass through the connected Barracuda Networks device for the specified time period.
- Allowed Applications – Displays the number of applications that were allowed for the specified time period.
- Blocked Applications – Displays the number of applications that were blocked for the specified time period.
- Blocked Policy – Displays the number of policy blocks for the specified time period.
- Blocked Spyware – Displays the number of spyware blocks for the specified time period.
- Blocked ATP – Displays the number of blocks made by your ATP (Advanced Threat Protection) subscription.
- Blocked IPS – Displays the number of blocks made by your IPS (Intrusion Prevention System) subscription.
- Blocked Virus – Displays the number of virus blocks for the specified time period.
- Connections – Displays the total number of connections made to the CloudGen Firewall for the specified time period.
You can also cycle through the various graphs by clicking the circles below the graph . Each circle represents a different graph subject.
Top Threats
All Threats – Displays all threats encountered for the specified time period. Includes all threats listed below.
IPS – Displays threats encountered by your IPS (Intrusion Prevention System) subscription for the specified time period.
Virus – Displays the number of viruses encountered for the specified period.
ATP – Displays threats encountered by your ATP (Advanced Threat Protection) subscription for the specified time period.
Botnet and Spywear – Displays botnet and spyware threats encountered for the specified period.
These graphs can be shown by User, Source IP, or Destination IP.
Productivity
Select to display a graph of the Top Super Categories (default), Top Categories, Top Users, or Top Domains from the drop-down menu on the top left. Adjust the units to display by Requests, Bandwidth, or Browsing Time with the drop-down menu on the top right.
Web Activity
Select to display a graph of total web activity or HTTPS traffic in Bandwidth (default) or Requests as measured by the Barracuda CloudGen Firewall.
HTTP traffic is the difference between Total Traffic and HTTPS Traffic shown on the graph.