

Barracuda SecureEdge Logs visualises logs by using statistics and logs collected on Sites. The SecureEdge Manager allows you to create logs for your connected Sites when Web Filtering is enabled. In addition, you can create and customize your own logs to simplify log information and details for connected Sites.
Requirements
Reporting is enabled by default on SecureEdge devices. If disabled, enable it in the Barracuda SecureEdge Manager via Infrastructure > Sites > Advance Settings. For more information, see How to Enable Reporting in SecureEdge.
You must update your SecureEdge appliances to version 9.0.4 or higher.
You must have a Site with Web Filtering enabled. For more information, see Web Filter Policies. Note: Web Filtering is always enabled for your connected Sites. However, you can disable it for the SecureEdge Access Agent. For more information, see Zero Trust Access Policies.
Port TCP/5044 must be allowed from the Site to the internet.
Barracuda XDR log streaming must be disabled.
Create a Log
Go to https://se.barracudanetworks.com and log in with your existing Barracuda Cloud Control account.
The chosen Tenant/Workspace is displayed in the top menu bar.
From the drop-down menu select the workspace you want to create a log for.
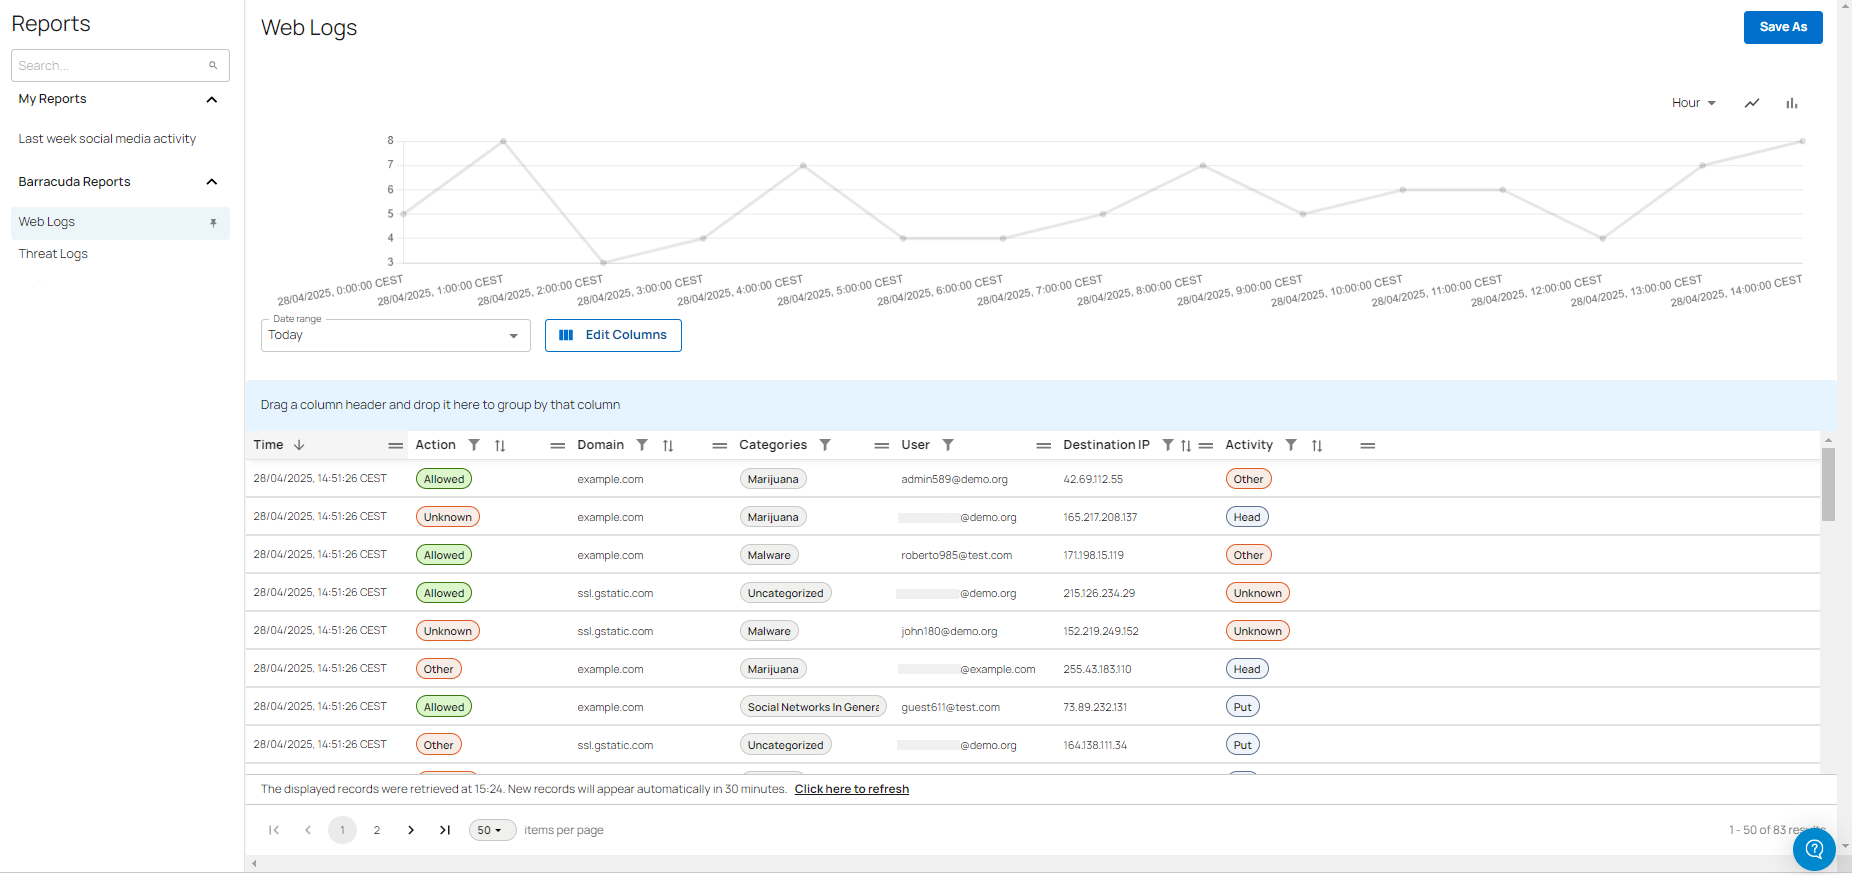
Go to Reports > Logs.
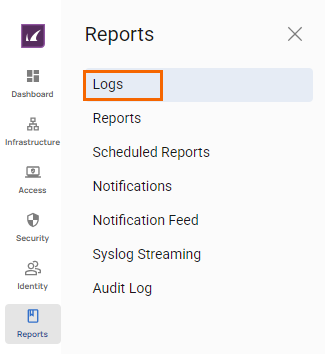
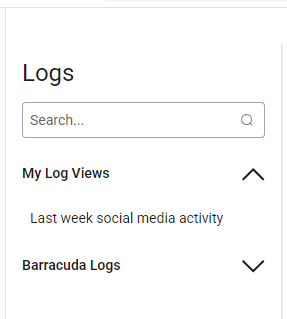
The Logs page opens. You can see two expandable sections:
My Log Views – Displays all custom logs.
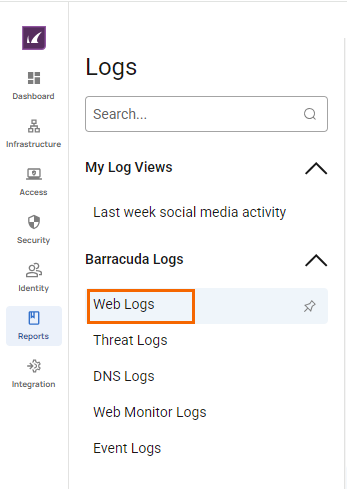
Barracuda Logs – Displays all Barracuda logs such as Web Logs, Threat Logs, DNS Logs, Web Monitor Logs, and Event Logs.
To create a log, you must select a log under Barracuda Logs. Click Web Logs.
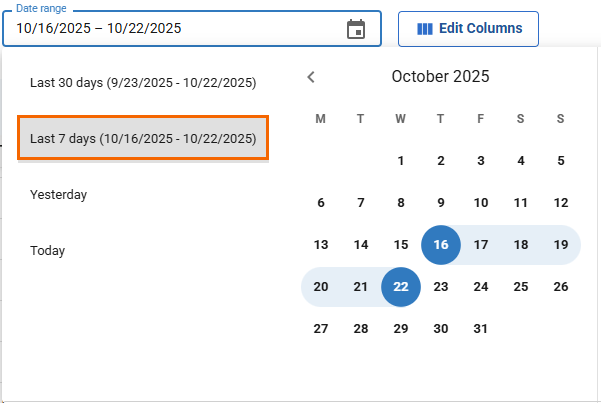
Select a date range for the Web Logs log. Note: By default, the date range filter is Today. The Date range field displays in the format
MM/DD/YYYY - MM/DD/YYYY. You can choose a date range between Last 30 days, Last 7 days, Yesterday, and Today. For example, in this case, select as your date range Last 7 days.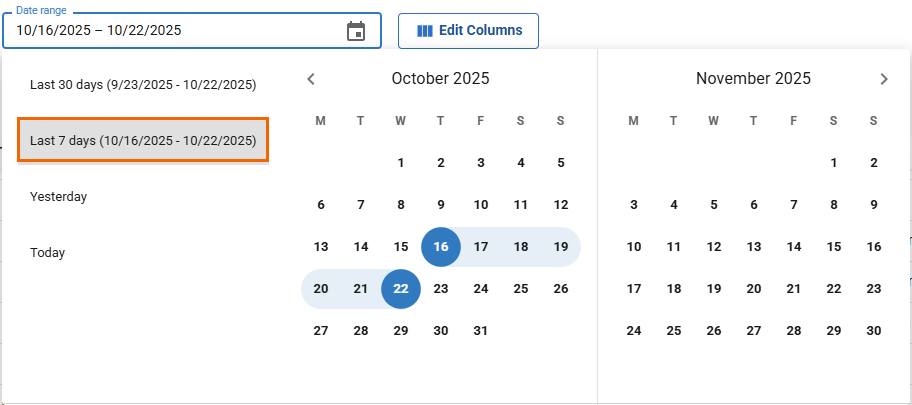
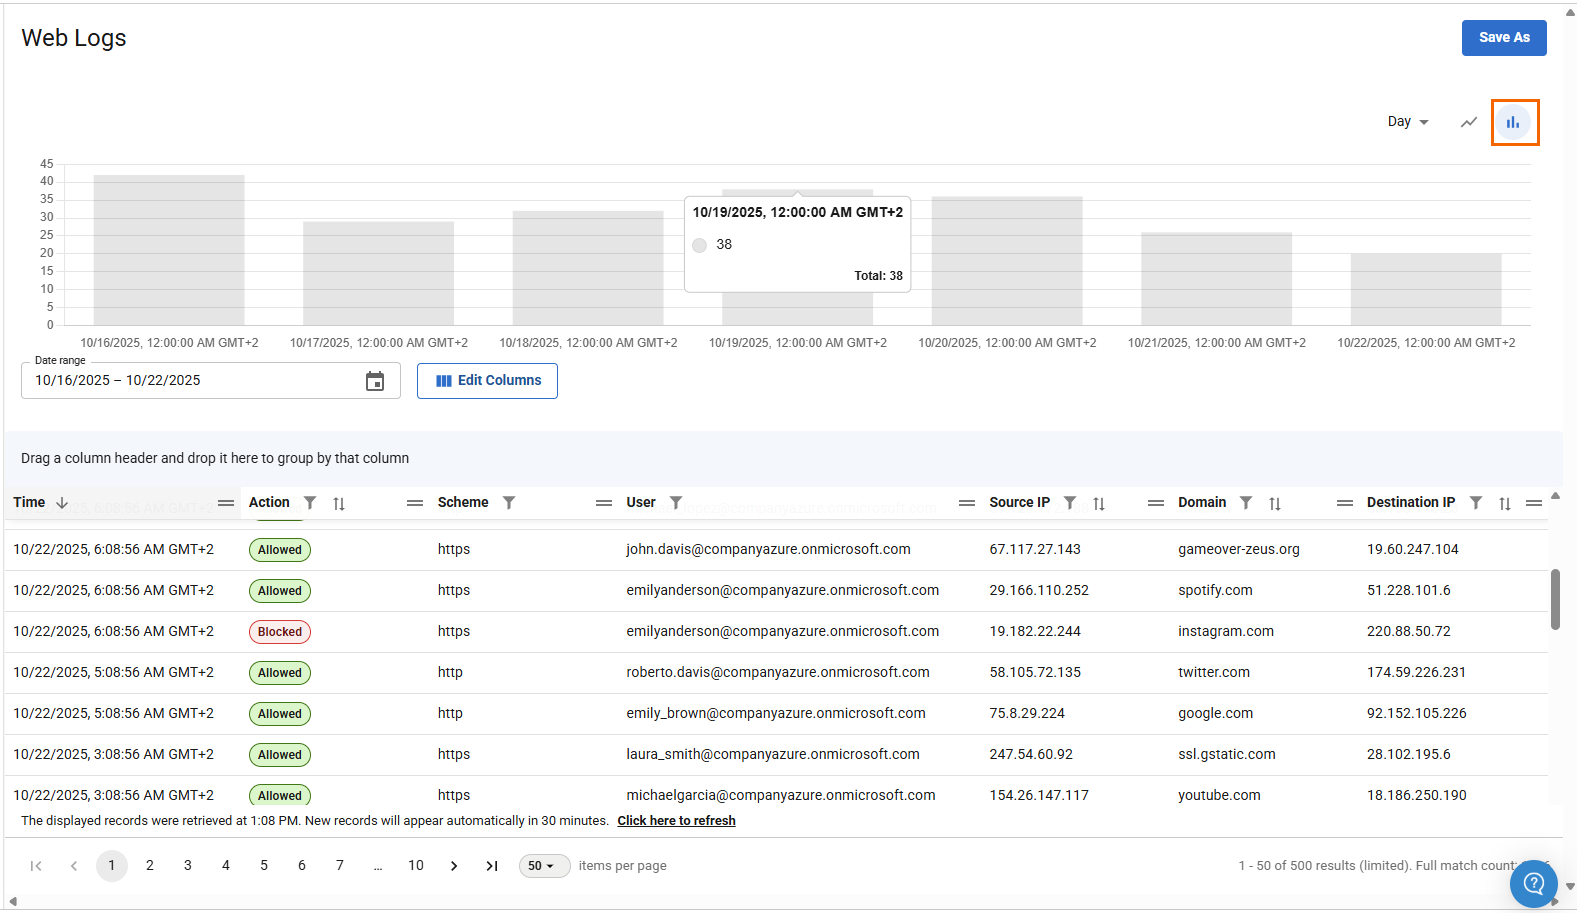
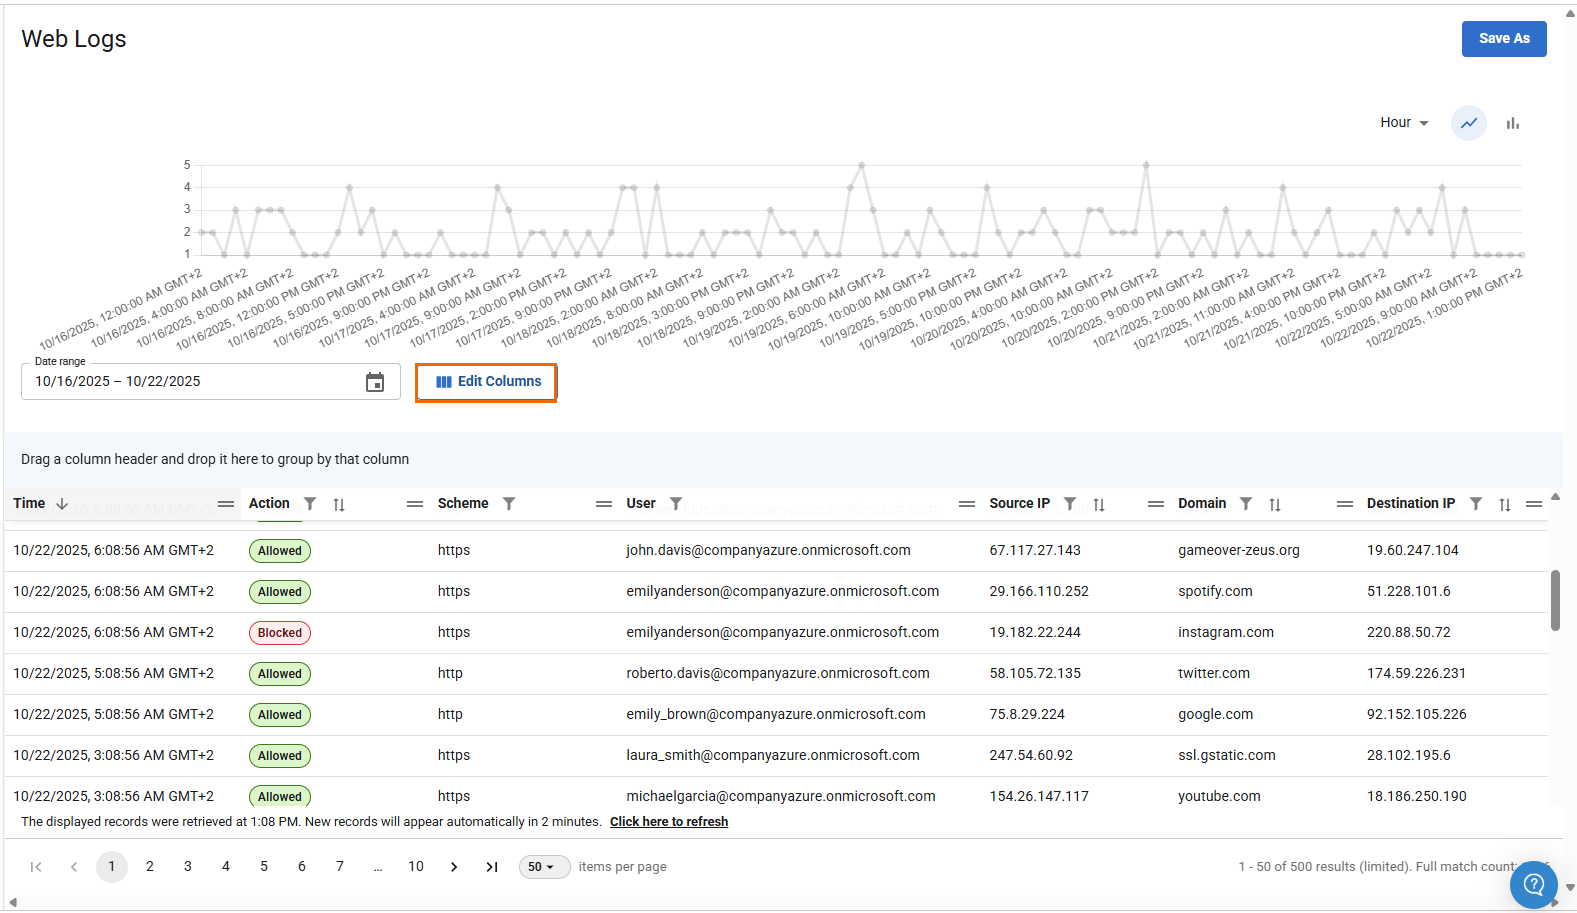
You can see that the Web Logs main page displays the following information:
A default table displays the queried data for the date range of Last 7 days with the columns Time, Action, Scheme, User, Source IP, Domain, and Destination IP.
Web Logs with respect to hours/days can be visualized in bar and line diagrams.
The page navigation icons are numbered, and you can set up to 100 items per page.
The option Click here to refresh refreshes the current list. By default, the refresh time is set to 30 minutes.
You can create custom logs and save them.
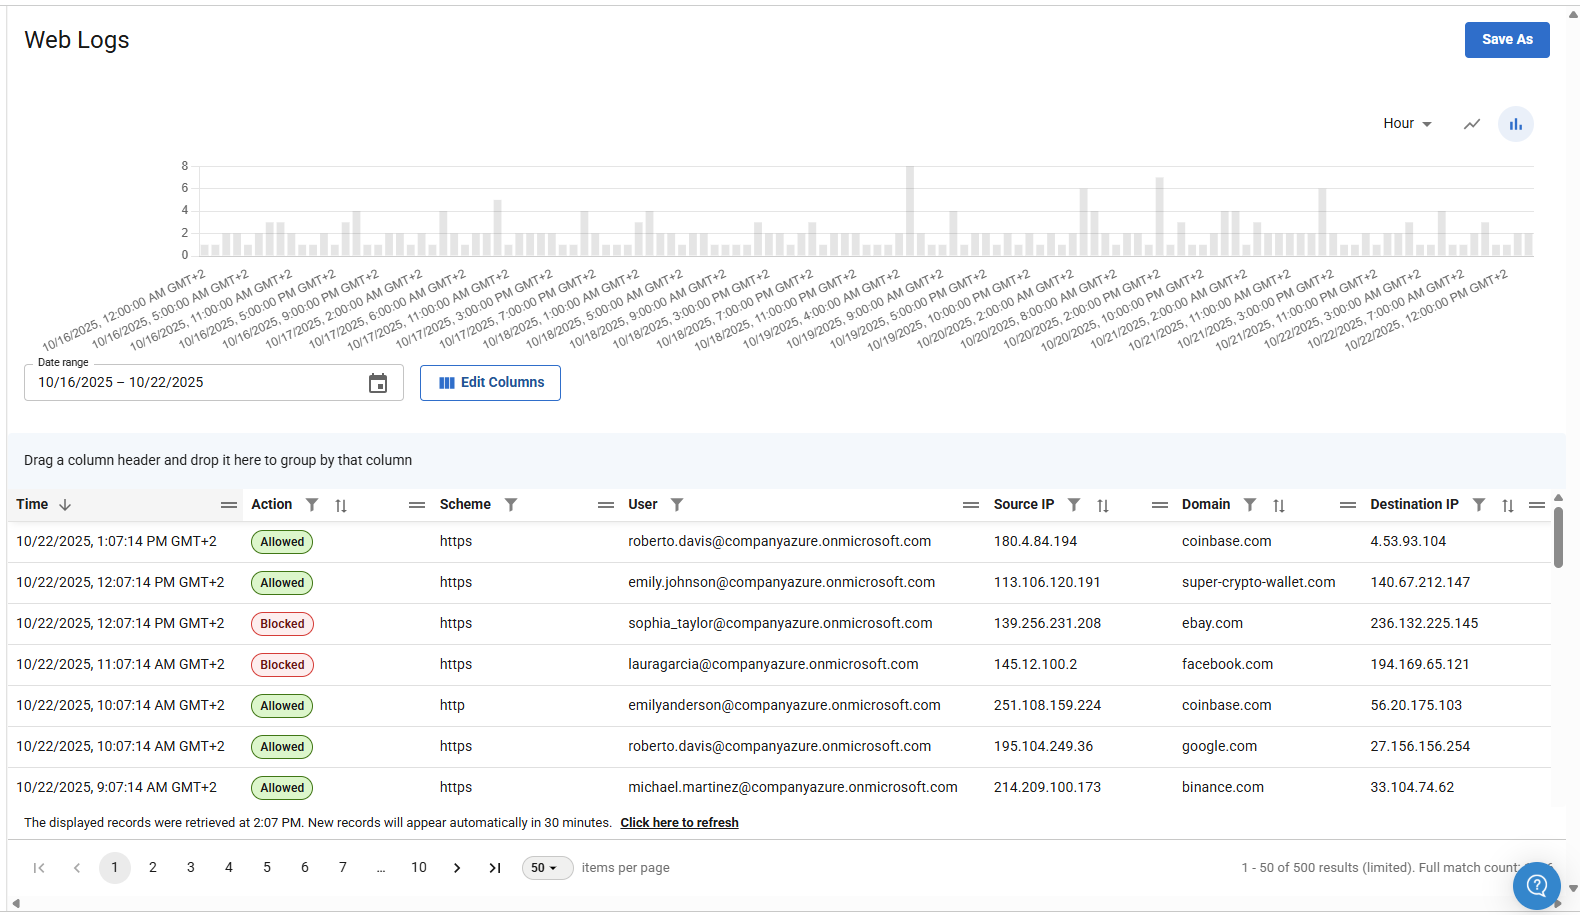
Example Web Logs bar diagram:
Example Web Logs line diagram
(Optional) Edit Visible Columns
To edit the columns of the Web Logs table:
To get more detailed information on Web Logs logs, click Edit Columns.
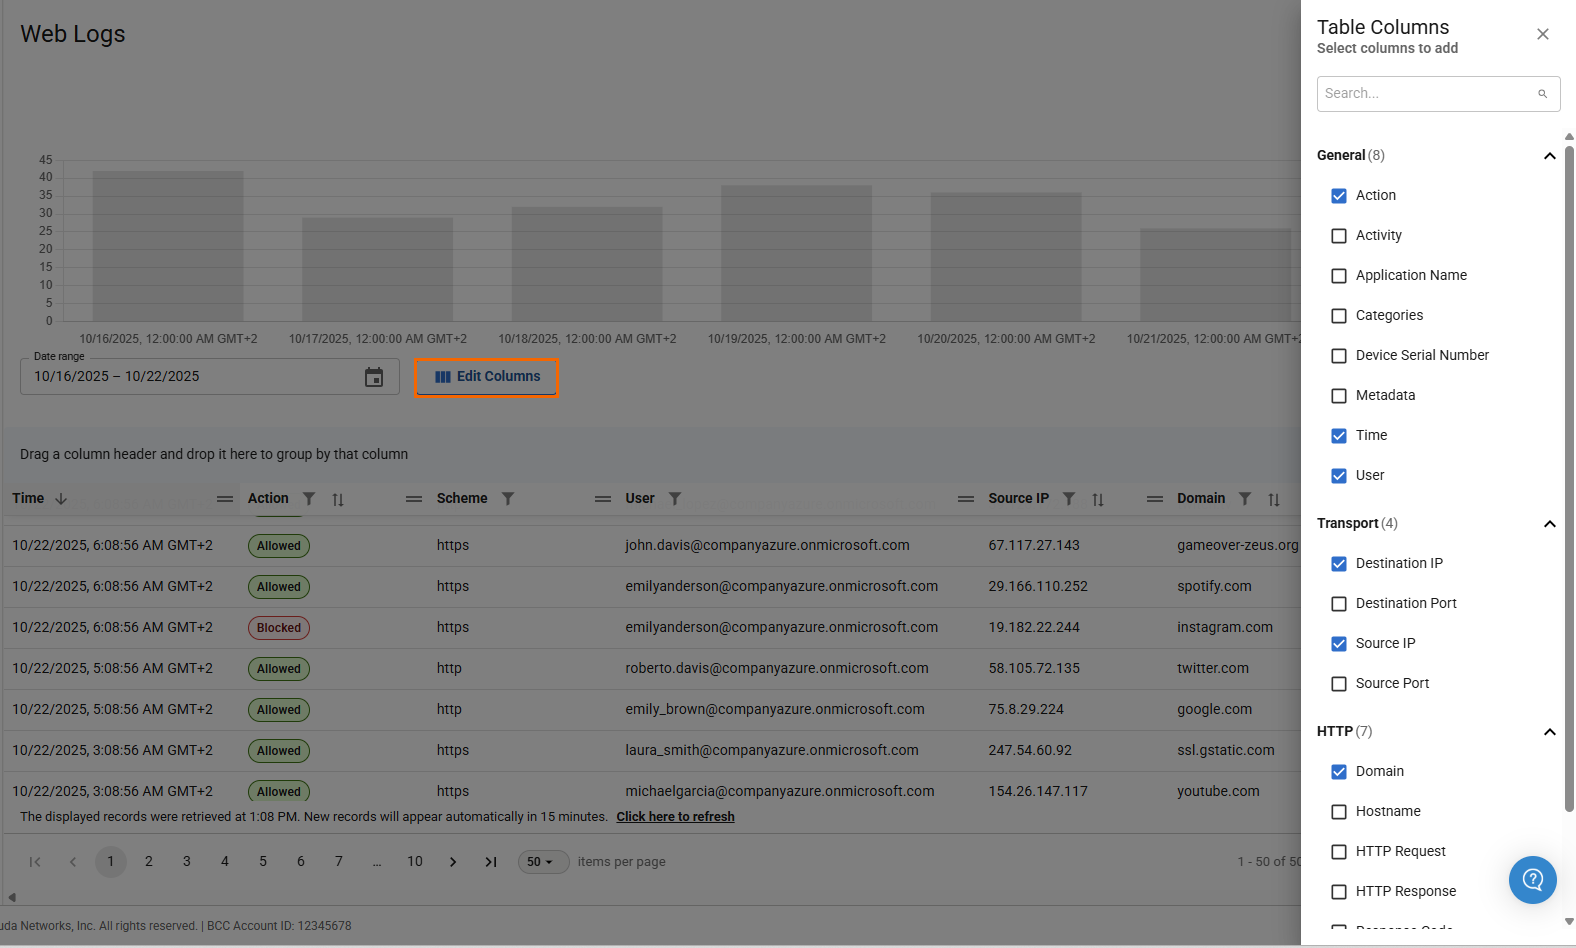
The Table Columns window opens and displays three expandable sections:
General – Includes file names such as Action, Activity, Application Name, Categories, Device Serial Number, Metadata, Time, and User.
Transport – Includes field name such as Destination IP, Destination Port, Source IP, and Source Port.
HTTP – Includes field names such as Domain, Hostname, HTTP Request, HTTP Response, Response Code, Scheme, and URL.
Select the field names under each section you wish to display the columns for.
(Optional) Create a Custom Log
The chosen Tenant/Workspace is displayed in the top menu bar.
From the drop-down menu select the workspace you want to create a log for.
To create a custom log, you must select a log under Barracuda Logs.
Click the log to create a custom log, for example, Web Logs.
The Web Logs page opens. Specify values for the following:
Date Range – Select the desired date range from the drop-down list. You can choose between Last 30 days, Last 7 days, Yesterday, and Today. Note: By default, the date range filter is Today. For example, in this case, select Last 7 days.
The Web Logs main page displays a default table with the queried data for the date range of Last 7 days with the columns Time, Action, Scheme, User, Source IP, Domain, and Destination IP. Note: Web Logs with respect to hours/days can be visualized in bar and line diagrams.
To get more detailed information on the Web Logs logs, click Edit Columns.
The Table Columns window opens and displays three expandable sections: General, HTTP, and Transport.
Select the field names under each section you wish to display the columns for, and click Save.
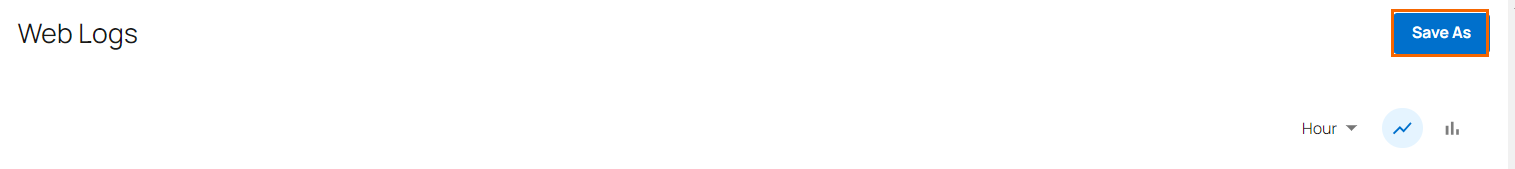
In the top-right corner of Web Logs page, click Save As.
The Save View windows opens. Specify a value for the following:
Save View – Enter the log name.
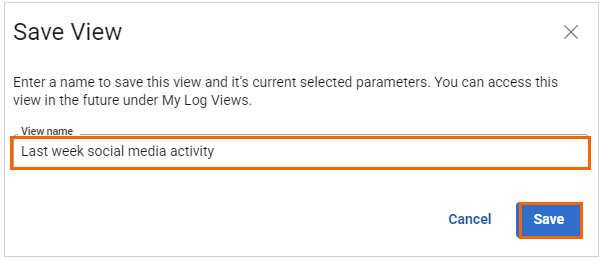
Click Save.
After saving the log, you will receive the message “Successfully saved the log”. You can see this custom log appears under the My Log Views section on the Logs page.
Click < Name of your Custom log>. Your custom log is displayed with selected Table Column parameters.
Rename an Existing Custom Log
To rename an existing custom log under the My Log Views section:
Go to Reports > Logs.
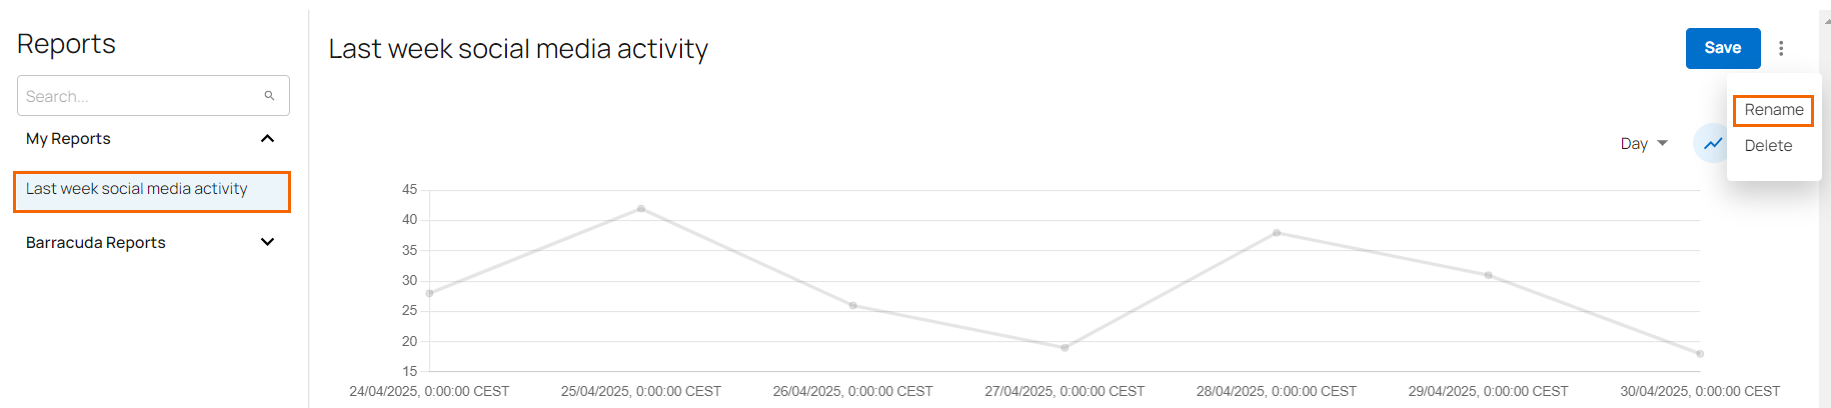
The Logs page opens. Select the custom log you want to rename.
In the top-right corner of the Web Logs page, click the icon of three vertical dots and click Rename.
The Rename View window opens. Specify a value for the following:
View name – Rename the view name.
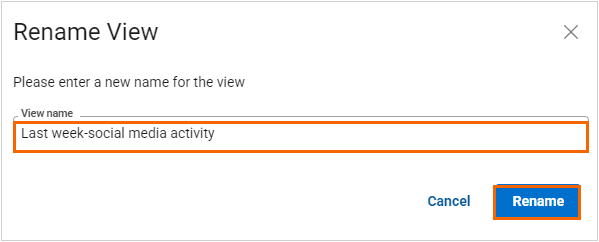
Click Rename.
You can see that the log with new name appears under the My Log Views section.
Remove an Existing Custom Log
To delete an existing custom log under the My Log Views section:
Go to Reports> Logs.
The Logs page opens. Select the custom log you want to remove.
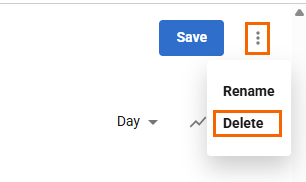
In the top-right corner of the Web Logs page, click the icon of three vertical dots and click Delete.
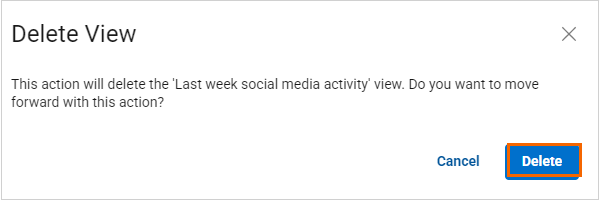
The Delete View window opens. Click Delete.
You can see that custom log has been removed from the My Log Views section.