

Barracuda SecureEdge offers logs to help you monitor various log activities throughout your network. On the SecureEdge Manager, you can see a variety of logs, such as Web Logs, Threat Logs, DNS Logs, Web Monitor Logs, and Event Logs. The logging data is streamed according to the region you select. Currently, you can select either Europe or North America, with Europe set as the default.
With SecureEdge Logs, you can do the following:
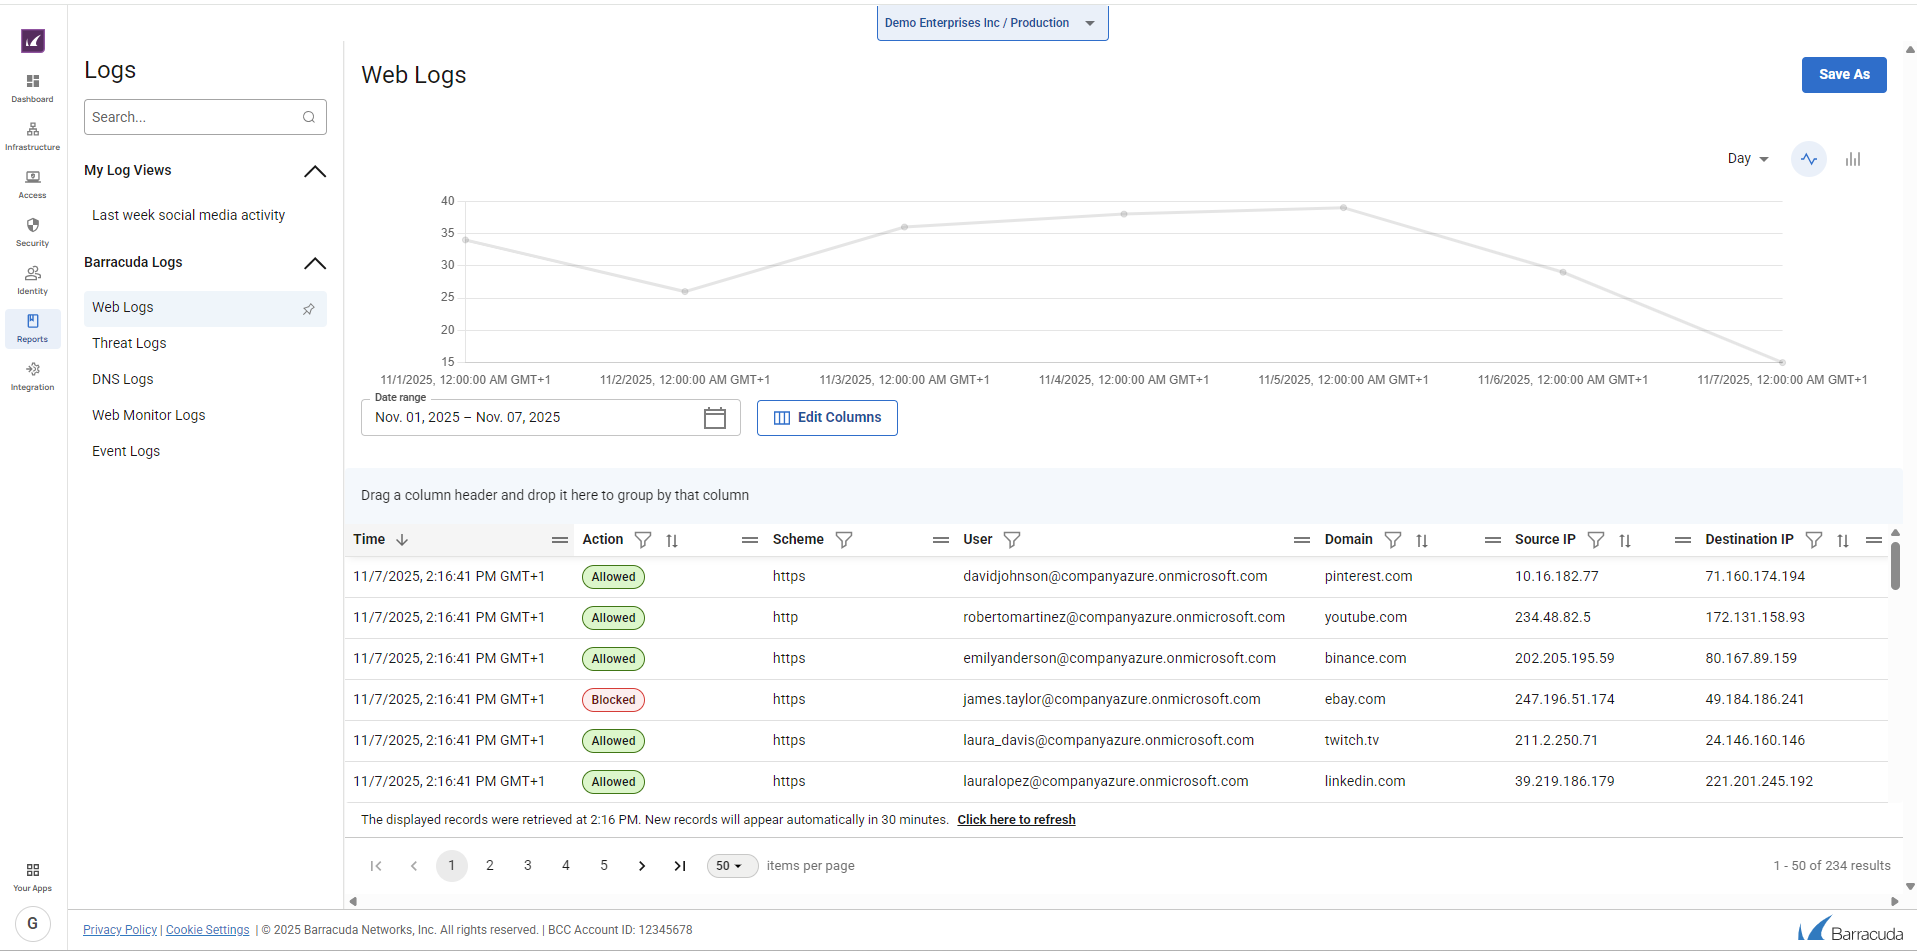
Change the log appearance as well as the displayed information per workspace. Toggle the visible columns using the option Edit Columns.
Search for matching logs and display logs on the Logs page.
Apply filtering and sorting to different data sources such as Web and Threat Logs .
Save custom logs.
Select date range for any log by Today, Yesterday, Last 7 days, and Last 30 days.
Access graphs, such as bar and line diagrams, for better visibility with respect to specific hours or days.
Drag a column header to group by that header and to see the Count list in descending order.
Pin logs by default.
Choose the number of entries per page. By default, the table shows the first 50 entries of the report.
Use the option “Click here to refresh” to display the latest records. The default refresh time is set to 30 minutes.
Rename and delete existing custom logs.
Use the Edit Columns button to add or remove columns.
For more information, click on the topic you are interested in: