

This article outlines how to create a customizable summary report within SecureEdge, and describes the configuration steps, data selection, and report delivery options to produce a concise, actionable overview.
Create a Report
Go to https://se.barracudanetworks.com and log in with your existing Barracuda Cloud Control account.
The chosen Tenant/Workspace is displayed in the top menu bar.
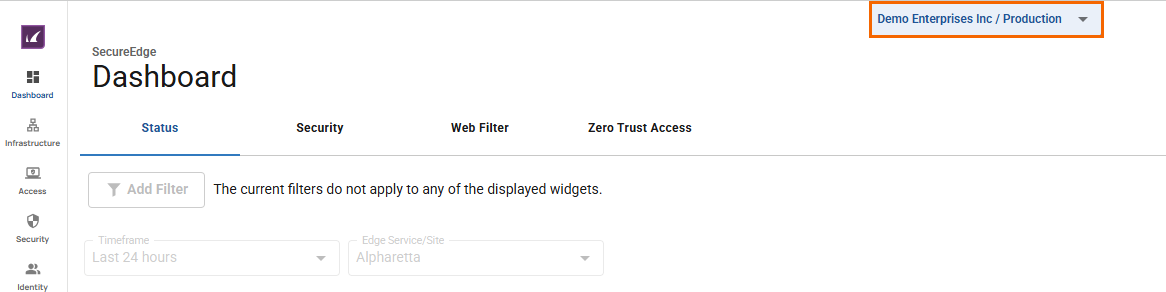
From the drop-down menu, select the workspace you want to create a summary report for.
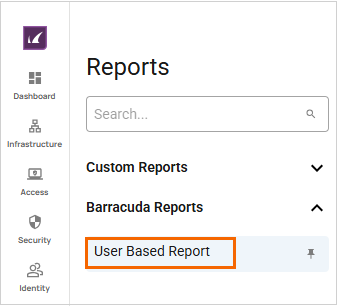
Go to Reports > Reports.
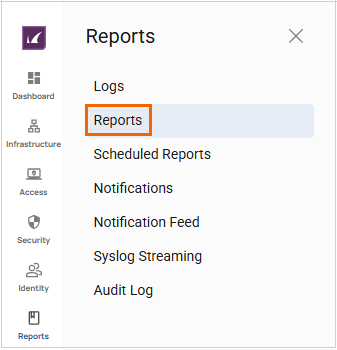
The Reports page opens. You can see two expandable sections:
Custom Reports – Displays all custom reports.
Barracuda Reports – Displays all Barracuda predefined reports.
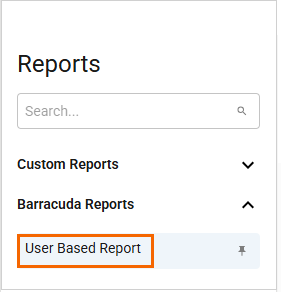
Built-in reports appear under Barracuda Reports. To create a report, select one under Barracuda Reports. In this case, click User Based Report.
Specify a value for the following:
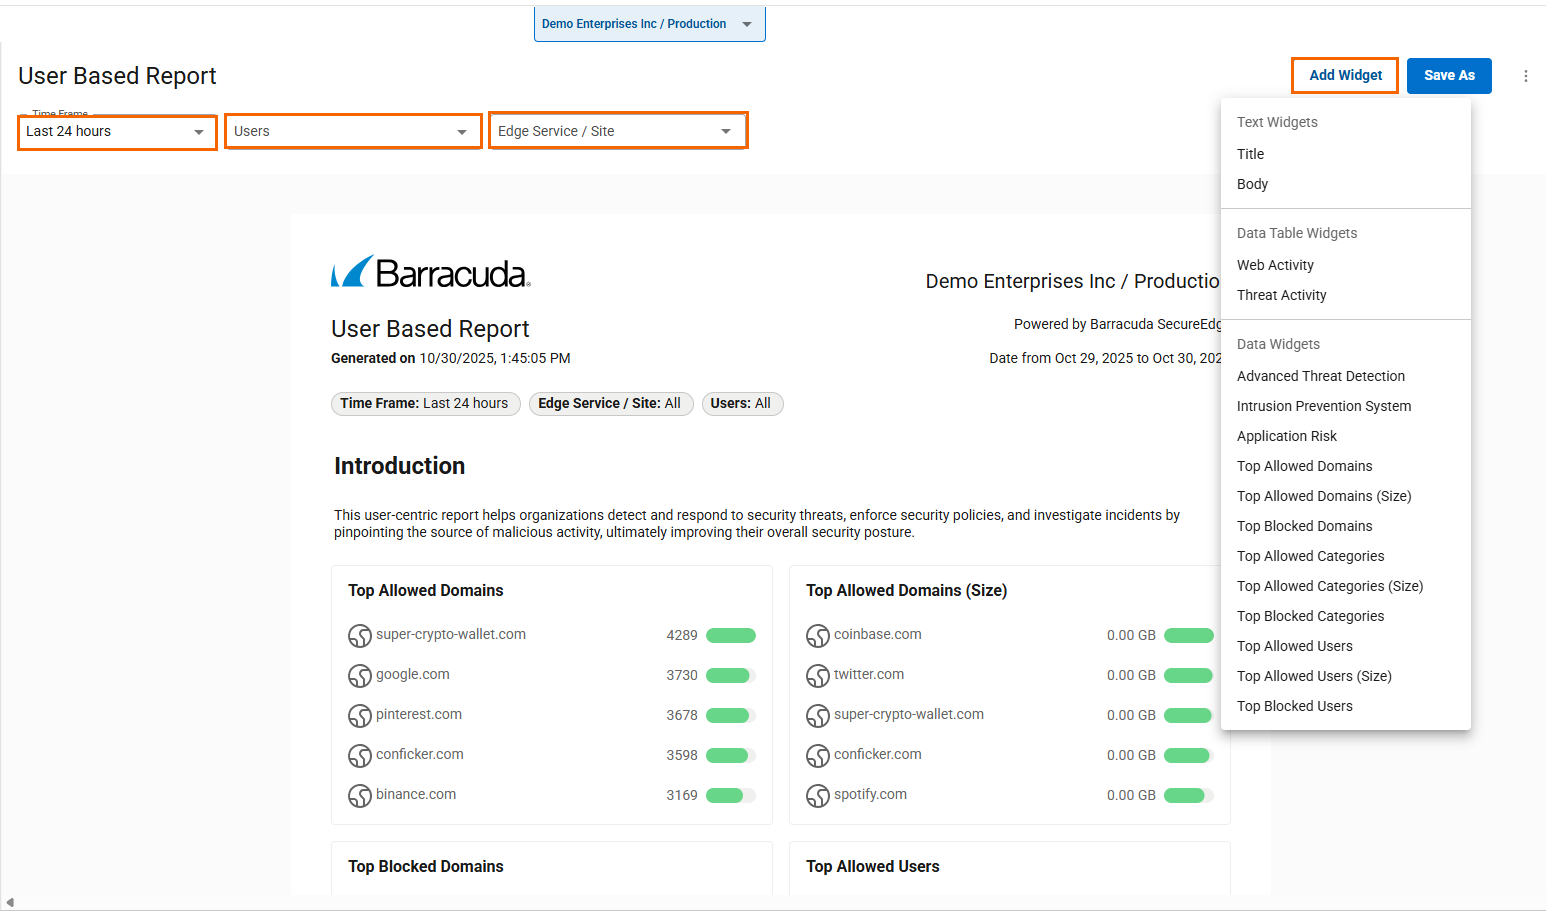
Time Frame – Select the time period you would like the report to cover. The Time Frame field displays in the format
MM/DD/YYYY - MM/DD/YYYY. You can choose a time frame between Last 24 hours, Last 7 days, and Last 30 days. For example, in this case, select as your date range Last 7 days.Users – Select a specific user or All users.
Edge Service / Site – Select a specific Edge Service or Site, or All Edge Services or Sites.
You can see that the Barracuda User Based Report main page displays the following information:
The report displays the queried data for the time frame of Last 7 days with the table-column widgets such as Top Allowed Domains, Top Allowed Domain (Size), Top Blocked Domains, Top Allowed Users, Top Allowed Users (Size), and Top Blocked Users.
You can see editable widgets, texts, and titles. Move a widget up or down with the arrow icons, or edit or delete it.
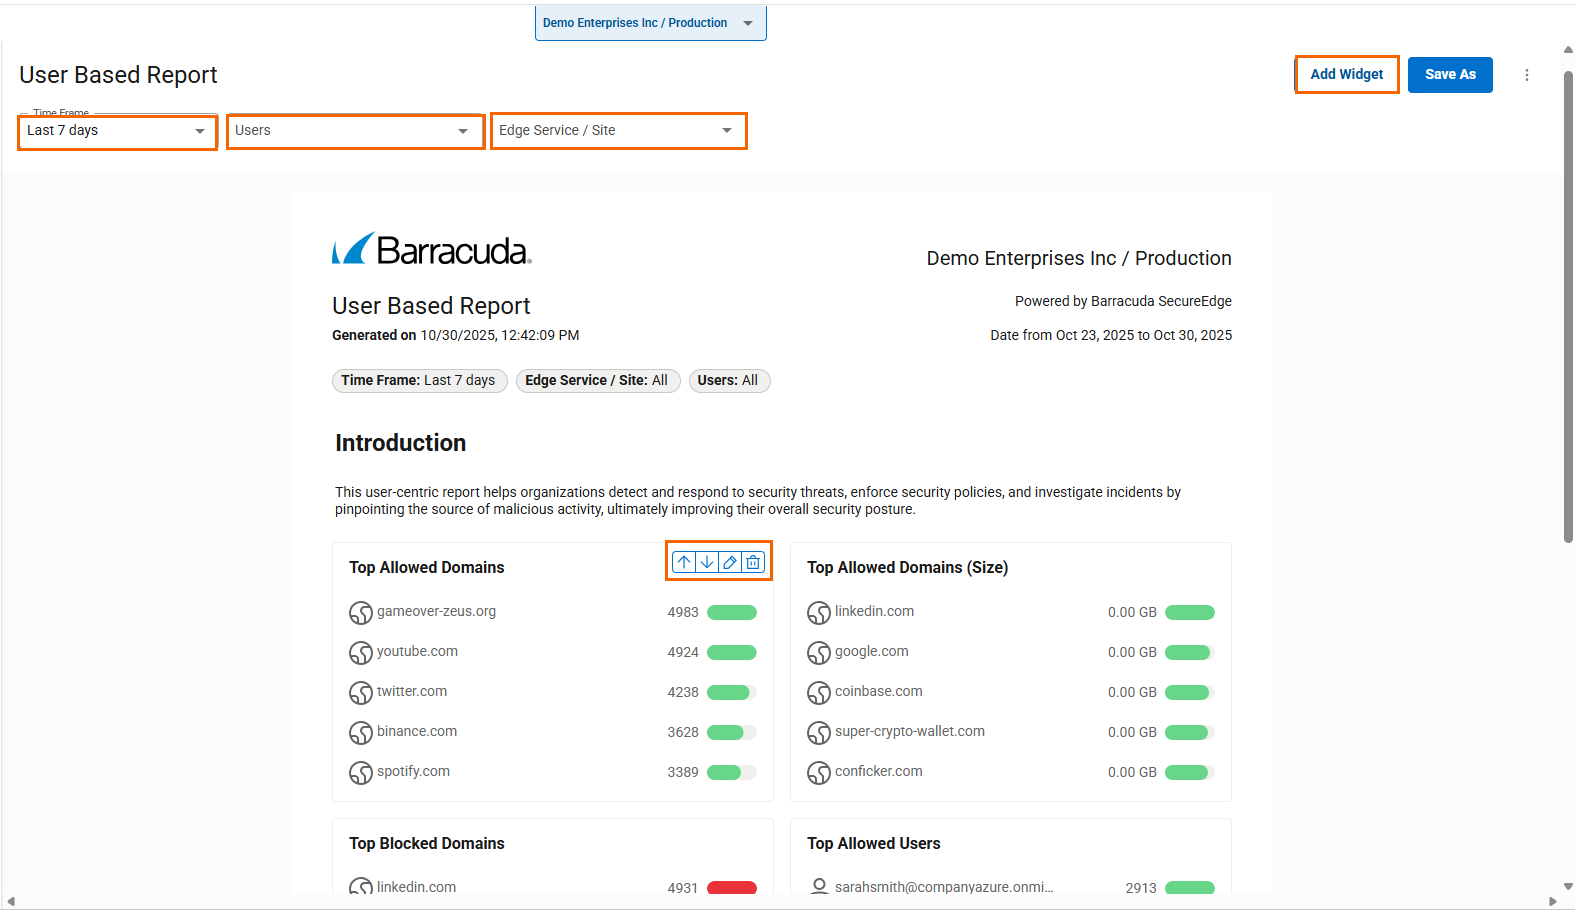
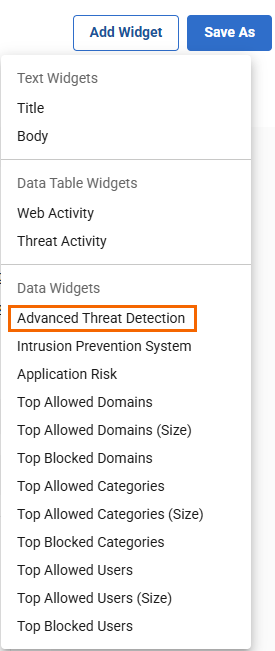
To add more widgets, click Add Widget.
From the drop-down menu, you can add Text Widgets, Data Table Widgets, or Data Widgets.
In the Data Widgets section, click Advanced Threat Detection.
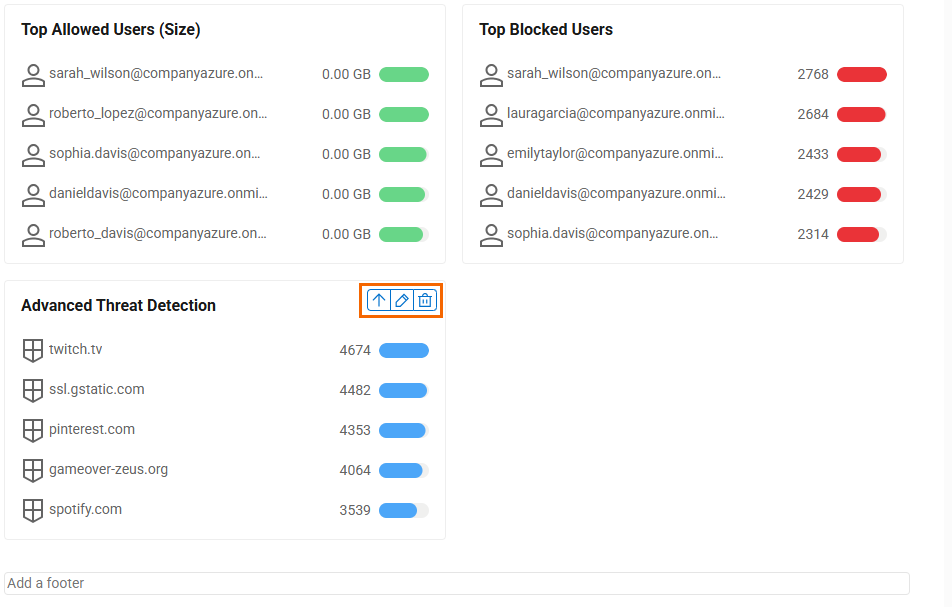
The Advanced Threat Detection widget has been added at the bottom of the User Based Report. Use the arrow icon to move it up, or edit or delete the widget.
To send a report:
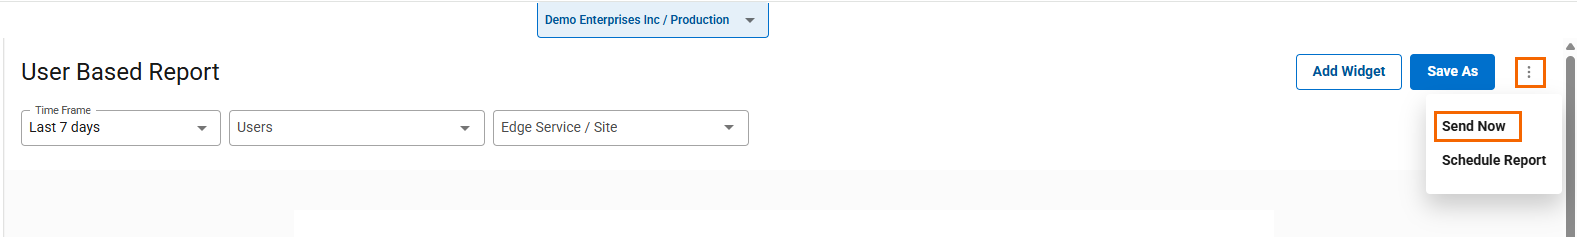
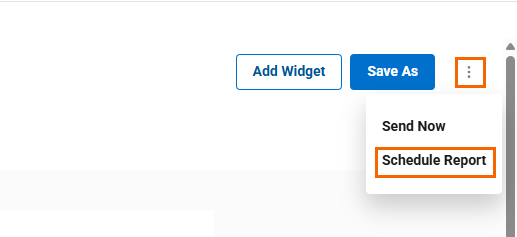
In the top-right corner of the User Based Report page, click the three vertical dots icon, then select Send Now.
The Send Report Now window opens. Specify a value for the following:
Recipients – Enter the email address of the recipient. To add multiple recipients, separate each email address with a comma and no spaces.
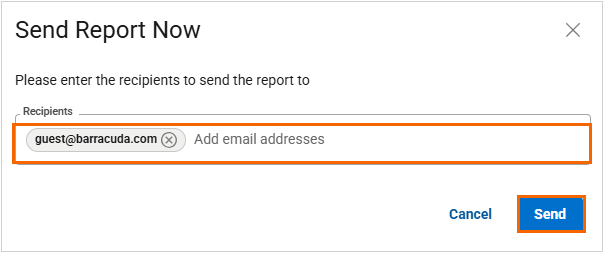
Click Send. The report will be attached as a file in the email. You will receive a user-based report via email
To schedule a report:
In the top-right corner of the User Based Report page, click the three vertical dots icon, then select Schedule Report.
The New Schedule window opens. Specify values for the following:
Time range – Select the time period you would like the report to cover. You can choose a time frame between Last day, Last 7 days, and Last 30 days.
Frequency – Select any one of the following:
To repeat the report once a day, select Daily.
To repeat the report once a week, select Weekly. Click the day of the week you want the report.
To repeat the report once a month, select Monthly. To run the report on a specific day and week every month, select the Every field and click the day of the week you want the report.
On – Click a day of the week.
At – Select a time with time zone.
Recipients – Enter the email address of the recipient. To add multiple recipients, separate each email address with a comma and no spaces.
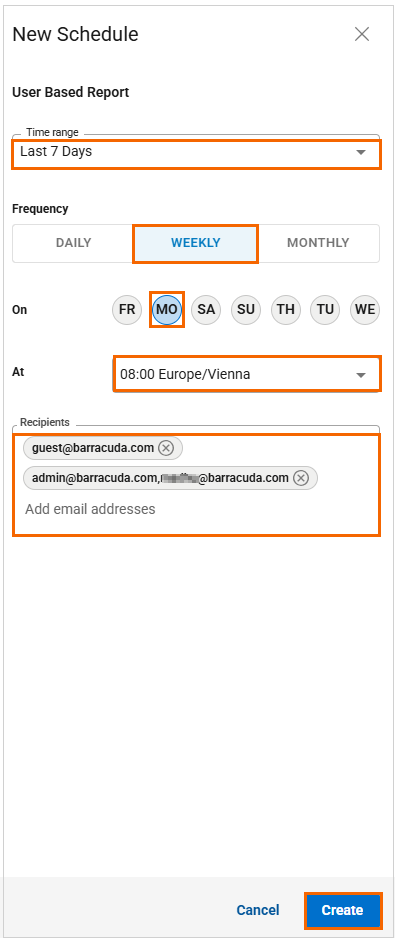
Click Create.
Verify that you receive the message Report Schedule Created Successfully. In addition, go to Reports > Scheduled Reports to confirm the new report schedule appears on the Scheduled Reports page.
(Optional) Create a Custom Report
Select the workspace you want to create a report for.
To create a custom report, you must select a predefined report under Barracuda Reports. For example, in this case, select User Based Report.
The Barracuda User Based Report page opens. Specify values for the following:
Time Frame – Select the desired time period from the drop-down list. You can choose a time frame between Last 24 hours, Last 7 days, and Last 30 days. For example, in this case, select as your time frame Last 7 days.
Users – Select a specific user or All users.
Edge Service / Site – Select a specific Edge Service or Site, or All Edge Services or Sites.
The summary User Based Report displays the last 7 days of your queried Data Widget in tabular format. You can do the following with your summary report:
Add more widgets by clicking Add Widget. Choose Text Widgets, Data Table Widgets, or Data Widgets from the drop-down menu. Select widgets to display information.
Move, modify, and delete each element as needed.
Change the appearance of your own customized reports, as well as the displayed information, and save them.
To save a customized report, click Save As in the top-right corner of the User Based Report page.
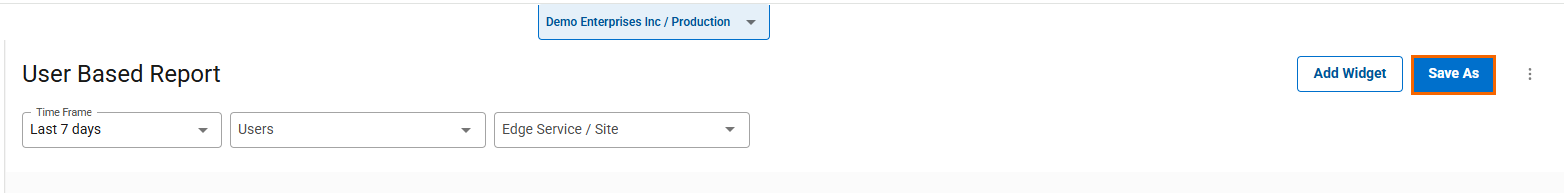
The Save Report opens. Specify a value for the following:
Report name – Enter a unique report name.
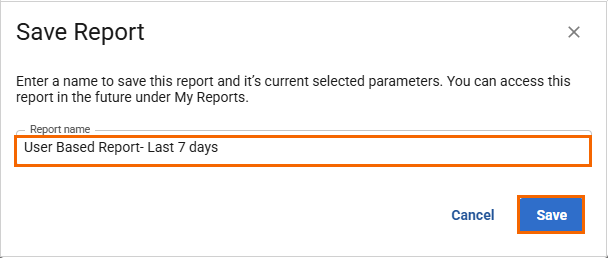
Click Save.
After saving the report, you will receive the message “Successfully saved the report”. These customized reports can be found under Custom Reports. Click <Name of your Custom Report> to display your custom report.