It seems like your browser didn't download the required fonts. Please revise your security settings and try again.
Barracuda SecureEdge

How to Configure Syslog Streaming in SecureEdge

  • Last updated on

The Barracuda SecureEdge Manager allows administrators to configure syslog streaming. Syslog streaming can be enabled for an entire workspace, but you can disable it for a specific Site, Private Edge, Edge Service for VWAN, or hosted Edge Service. You can stream logs to syslog using either UDP or TCP. You can also stream logs to syslog using TCP with a certificate. HA pairs must stream logs either directly or via the active box. New Edge Services inherit the syslog settings from your existing workspace.

Configure Syslog Streaming

  1. Go to https://se.barracudanetworks.com and log in with your existing Barracuda Cloud Control account.

  2. In the left menu, click the Tenants/Workspaces icon and select the workspace you want to configure syslog streaming for.

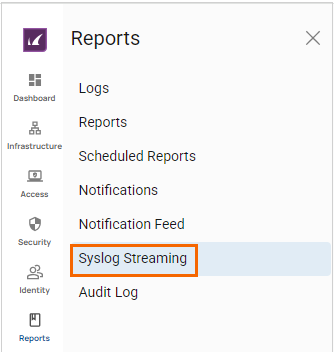
  3. Go to Logs and Reporting > Syslog Streaming.
    goto-SyslogStreaming.png

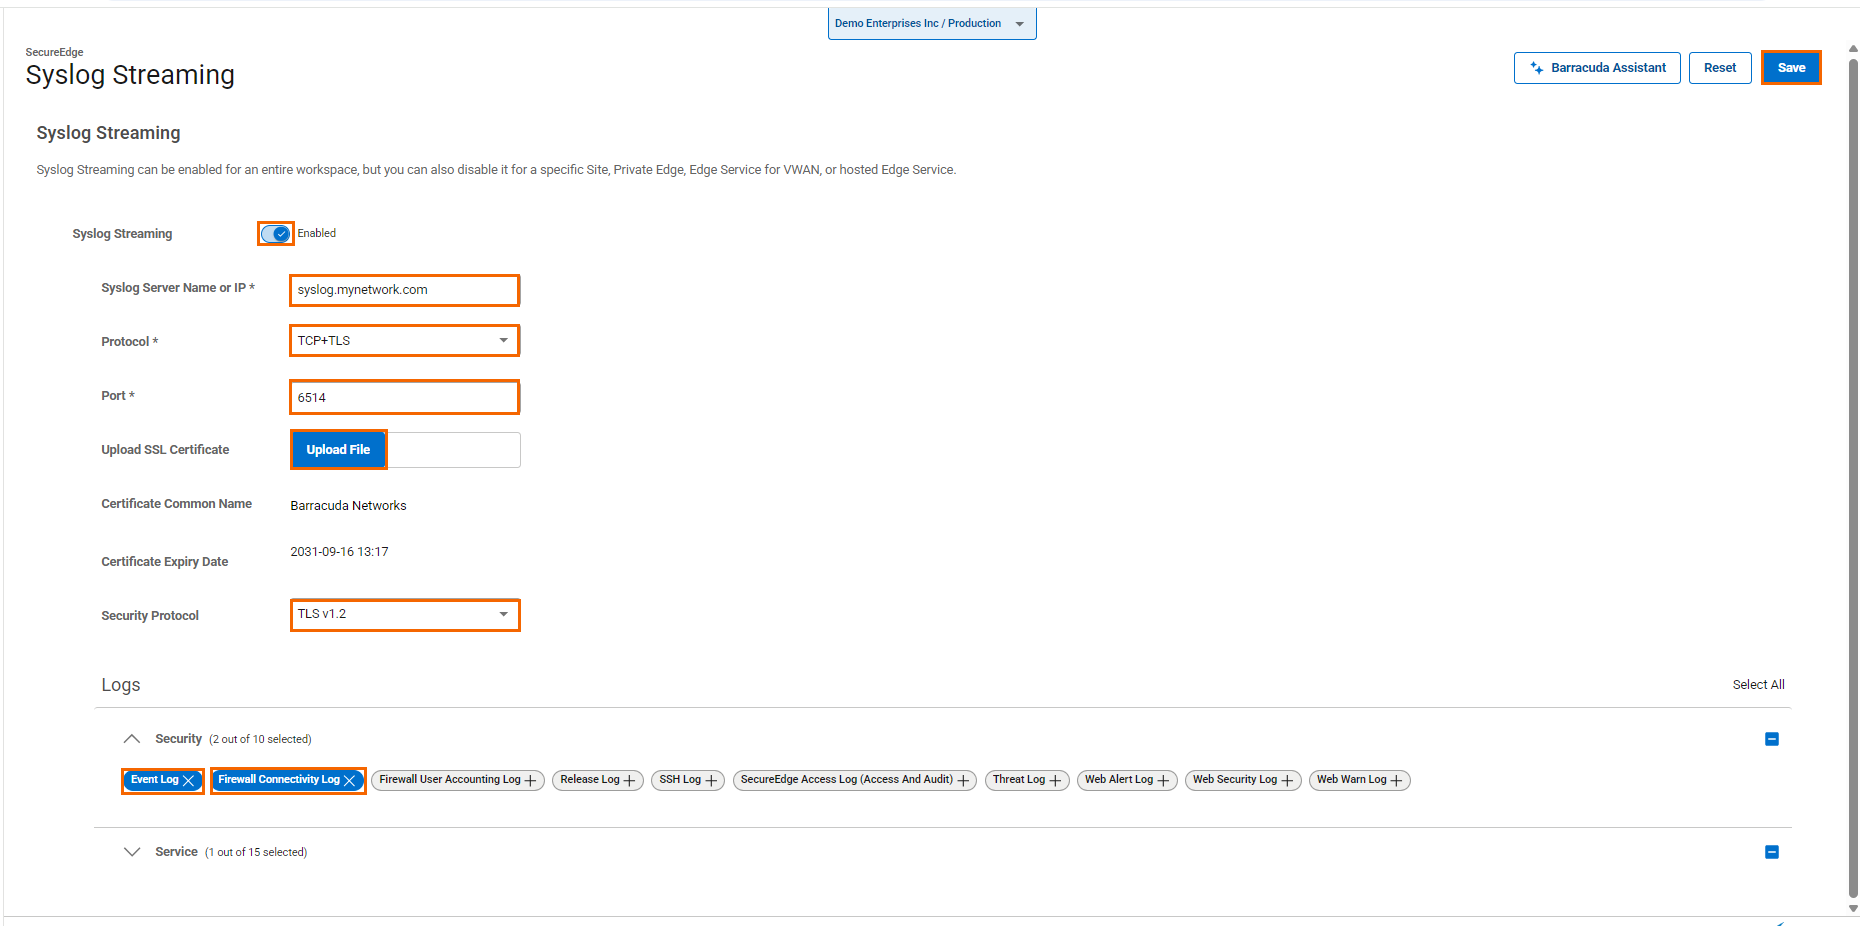
  4. The Syslog Streaming page opens. Specify values for the following parameters: 
    • Enable Syslog – Click to enable/disable. By default, syslog is OFF.
    • Syslog Server – Enter the IP address or hostname of your syslog server. Note: Only one destination syslog server is supported.
    • Protocol – Select a data transfer protocol from the drop-down list. You can choose between UDP, TCP, and TCP+TLS
      When TCP+TLS selected, the following options are available:
      • Upload SSL Certificate – Click Upload File to upload a SSL Certificate. Note: For SSL Certificates, only the .pem file format is supported. 
      • Certificate Common Name – If SSL Certificate has been uploaded successfully and the configuration is saved, you will be provided with certificate name and expiry date. For example, in this case: Barracuda Networks. 
      • Certificate Expiry Date – You are provided with expiration date of your SSL Certificate.
      • Security Protocol – Select a security protocol from the drop-down list. The default security protocol TLS1.2 is enabled for TCP+TLS. You can choose between TLSv1.2, TLSv1.1TLSv1.0, and SSLv3

    • Port – Enter a target port for your syslog server. The default UDP port is 514, TCP port is 601, and TCP+TLS port is 6514. 
    • Logs – Select the appliance logs you want to stream. You can choose at least one log from either section, such as Security and Service.
      The following Logs are available:

      Security – The following options are available:

      • Event Log – Contains log files generated by security events. For more information,  see Security Events. Also, contains log files generated by operational events. For more information, see Operational Events.
      • Firewall User Accounting Log – Provides log file about log entry for every user log-in and log-off for a firewall connection. Also, statistics are logged periodically for all the users which are logged-in.
      • Release Log – Contains log files about processes related to release updates, including hotfixes, security subscriptions, update server reachability, and release checks.
      • SSH Log – Displays log files about internal processes that are generated by the box ssh daemon, such as startup, read and write operations, etc.
      • SecureEdge Access Log (Access And Audit) – Provides informational log files about login and access attempts to the CloudGen Firewall, displaying access source, and opening and closing of sessions.
      • Firewall Connectivity Log – Displays firewall log files providing in-depth information about firewall rule processing. All entries of this log file are pipe separated information. Depending on the configured setting, they are in the format ...|key=value|key=value|... or ...|value|value|... format. For information how to alter between both formats, see General Firewall Configuration.
        • Time –  Timestamp of the respective log entry.
        • Type  – Information about the Type of log entry. E.g. Security or Info
        • Action – Information about the action taken according to the firewall ruse set configuration.
        • type  – Information about the origin type of traffic and ruleset used.
          • LIN – Local In. The incoming traffic on the host firewall.
          • LOUT – Local Out. The outgoing traffic from the host firewall.
          • LB – Loopback. The traffic via the loopback interface.
          • FWD – Forwarding. The outbound traffic via the forwarding firewall.
          • IFWD – Inbound Forwarding. The inbound traffic to the firewall.
          • PXY – Proxy. The outbound traffic via the proxy.
          • IPXY – Inbound Proxy. The inbound traffic via the proxy.
          • TAP – Transparent Application Proxying. The traffic via stream forwarding.
          • LRD – Local Redirect. Redirected traffic configured in forwarding ruleset.
        • proto –The protocol that was used. For example, TCP, UDP, or ICMP.
        • srcIF – The source network interface of the session.
        • srcIP – The source IP address of the session.
        • srcPort – The source port of the session.
        • srcMAC – The MAC address of the session's source network interface.
        • dstIP – The destination IP address of the session.
        • dstPort – The destination port of the session.
        • dstService – The destination service of the session.
        • dstIF – The destination network interface of the session.
        • rule – The name of the firewall rule processing the session.
        • Info – Operational information for the session.
        • srcNAT – Source NAT address of the session.
        • dstNAT – Destination NAT address of the session.
        • duration – Duration of the session.
        • count – Number of sessions processed.
        • receivedBytes – Received traffic of a session in bytes.
        • sentBytes – Sent traffic of a session in bytes.
        • receivedPackets – Received traffic of a session in packets.
        • sentPackets – Received traffic of a session in packets.
        • user – The name of the user, if the session was handled by a firewall rule that requires authentication.
        • protocol – The protocol of a session. For example, TCP, UDP, or ICMP.
        • application – The application context of a session.
        • target – The application target.
        • content – The application content.
        • urlcat – The URL category the session belongs to.
      • Threat Log – Displays log files generated by ATP, IPS, and DNS Sinkhole.
      • Web Alert Log – Contains the log files about alerts.
      • Web Security Log – Contains log files about actions such as allowing and blocking URL requests if configured.
      • Web Warn Log – Displays log files about warnings that the user has clicked on continue to visit the webpage.

      Service – The following options are available:

      • Access Control Service Log – Provides log files created by the Access Control service and shows information about access control policy processing and monitored actions and registry checks according to the configured log level.
      • DHCP Enterprise Service Log – Provides log files created by the DHCP service and shows information about DHCP processes, requests, and IP address assignment.
      • DNS Log – Contains log files created by the DNS service providing information about DNS configuration, listening interfaces, and DNS zone activity and processes.
      • Fatal Log – Marks system critical log events. Log contents of the fatal log (log instance name: fatal). All fatal errors that can occur are, in addition to the original log file, collected in the Fatal log. The original log file is added in the fatal log message text as a prefix.
      • Firewall Authentication Log – Contains log files about opening, connection status, and closing of firewall sessions, displaying IP address and port of the connected clients and peers. Information is displayed in case of login failures, file requests, and transactions concerning fwauth, errors or SSL certificate failures.
      • Firewall Log – Displays notification logs about Forwarding Firewall startup/shutdown with the location path and provides information about firewall operations, such as configuration loading, updates, and changes. Further logs in this section provide information on installation of updated settings and firewall rules.
      • OSPF/RIP/BGP Service Log – Contains log files created by dynamic routing protocols such as OSPF, RIP, or BGP.
      • Panic Log – Marks critical log events compromising the system's functionality and stability. Log contents of the panic log (log instance name: panic)
      • SD-WAN Log – Provides log files about SD-WAN data such as firewall stores the Min/Avg/Max value of the throughput rate every 5 minutes.
      • URL Filter Log – Provides log files about the Web Filter service, showing information about licensing, and URL filtering processes and actions.
      • VPN Service Log – Provides informational log files about the status of VPN sessions, showing tunnel transport, keying, and updates, and displays notifications in case of tunnel and transport failure.
      • Virus Scanner Log – Contains log files created by AVIRA antivirus, providing engine and VDF version, and displays information about virus scanning, threat detections, and actions.
      • Web Monitor Alert Log – Contains log files created by web monitoring policies.

      SyslogStreaming.png

  5. Click Save.

After the configuration is complete, Sites and Edge Services in the selected workspace will then stream to your syslog server.

Disable Syslog Streaming for Specific Sites 

You can disable syslog streaming for a specific site in your selected workspace:

  1. Open https://se.barracudanetworks.com/ in your web browser and log in with your existing Barracuda Cloud Control account.

  2. In the left menu, click the Tenants/Workspaces icon and select the workspace containing your site.

  3. Go to Infrastructure > Sites
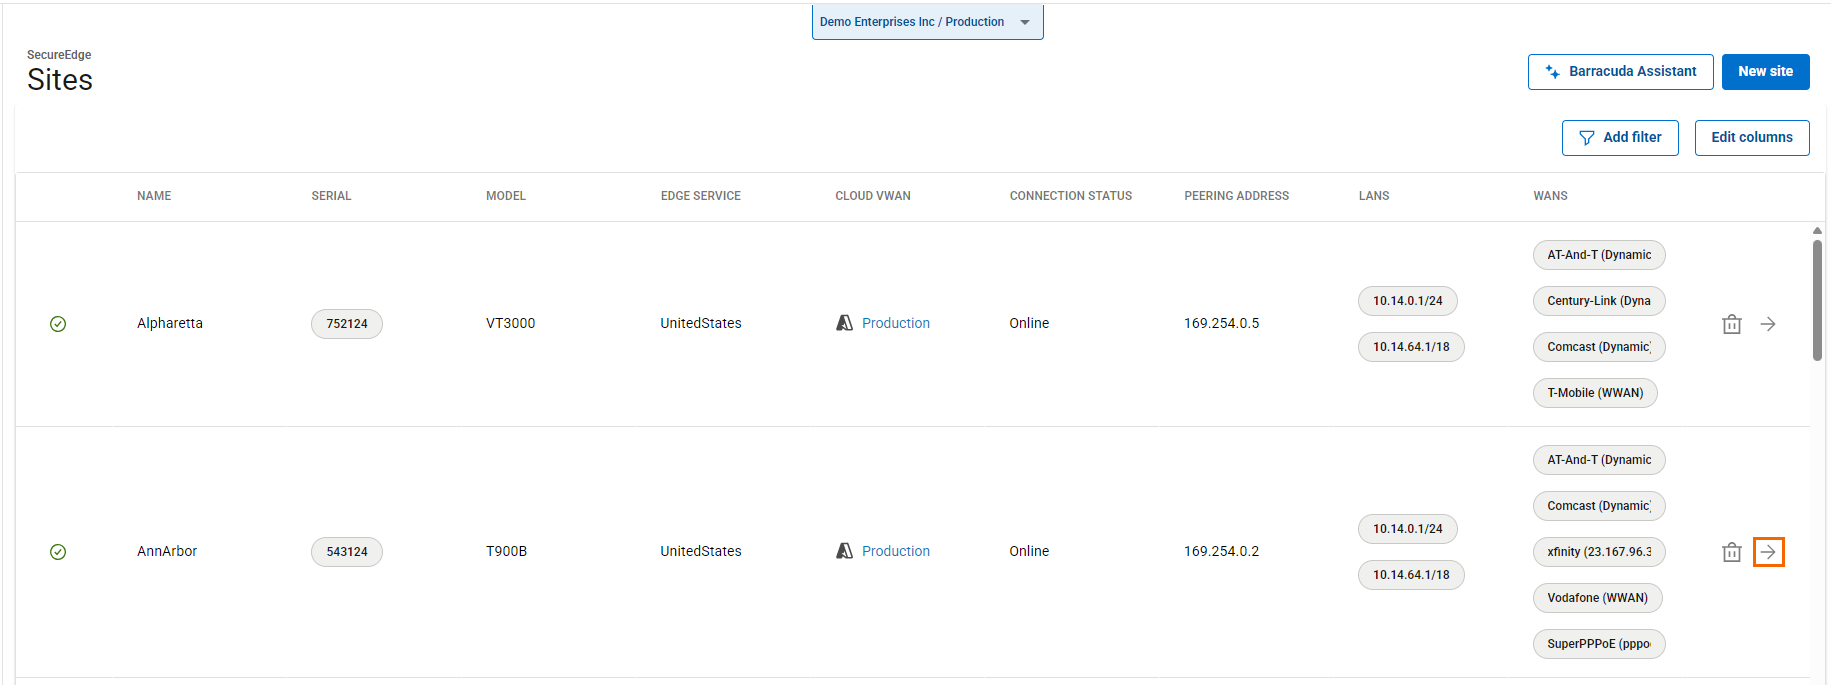
  4. The Sites page opens. Select the site you wish to disable syslog streaming for. You can either search for the name or serial, or use filters to tailor the list of displayed sites. You can also simply scroll through the list.
  5. Click on the arrow icon next to the site.
    ClickSiteArrow.png
  6. In the site menu, go to Settings > ADVANCED SETTINGS.
    gotoSite-AdvSetting.png
  7. At the bottom of the window, click to Disable Syslog Streaming.
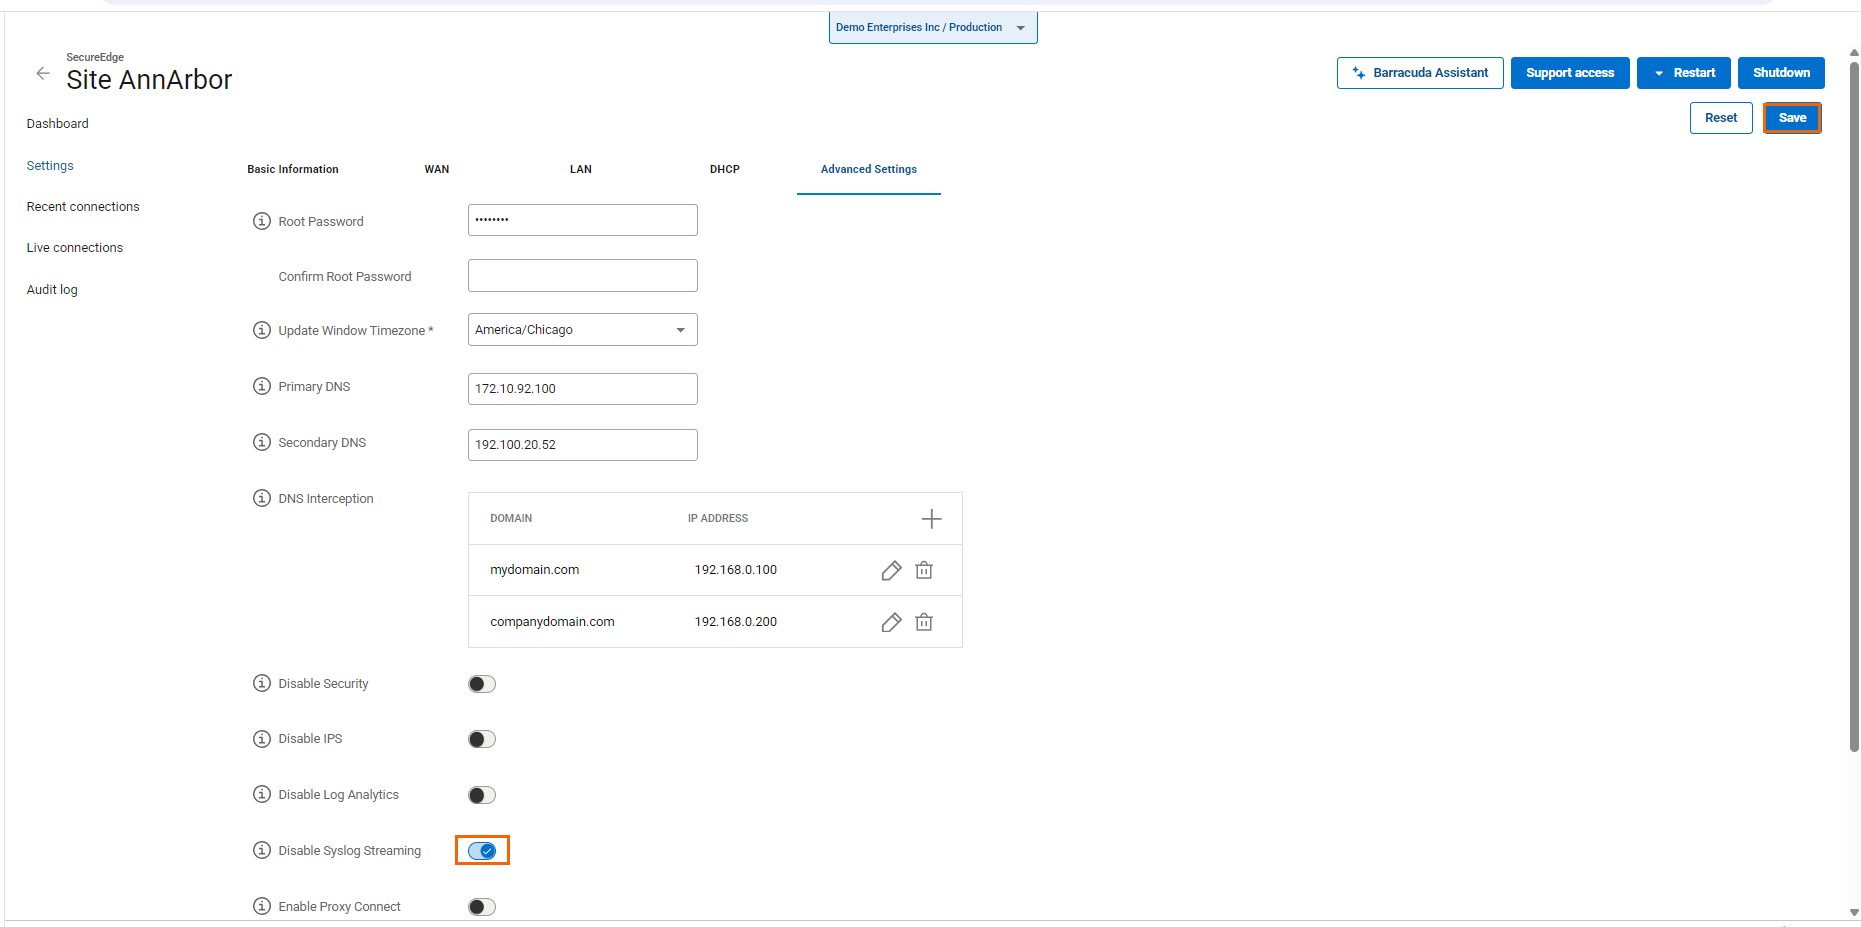
    SiteSyslogDisable.png
  8. Click Save.

After the configuration is saved, the selected site in your selected workspace stops streaming logs to syslog.

Disable Syslog Streaming for an Edge Service 

You can disable syslog streaming for a specific edge service in your selected workspace:

  1. Go to https://se.barracudanetworks.com and log in with your existing Barracuda Cloud Control account.
  2. In the left menu, click the Tenants/Workspaces icon and select the workspace containing your edge service.
  3. Go to Infrastructure > Edge Services
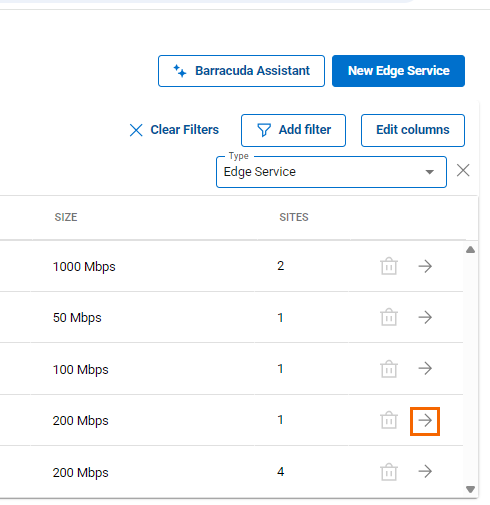
  4. The Edge services page opens. Select the edge service you wish to disable syslog streaming for. 
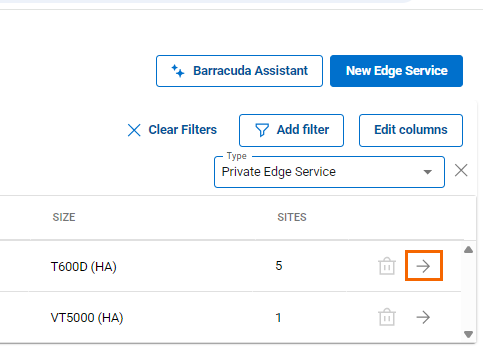
  5. Click on the arrow icon next to the edge service you are interested in. 
    Click-ES.png
  6. The selected edge service page opens. In the edge service menu, click Settings.
  7. Click to Disable Syslog Streaming.
    EdgeServiceSyslogDisable.png
  8. Click Save.

Disable Syslog Streaming for a Private Edge Service

You can disable syslog streaming for a specific private edge service:

  1. Go to https://se.barracudanetworks.com and log in with your existing Barracuda Cloud Control account.
  2. In the left menu, click the Tenants/Workspaces icon and select the workspace containing your private edge service.
  3. Go to Infrastructure > Edge Services
  4. The Edge services page opens. Select the private edge service you wish to disable syslog streaming for. 
  5. Click on the arrow icon next to the private edge service you are interested in. The selected private edge service page opens.
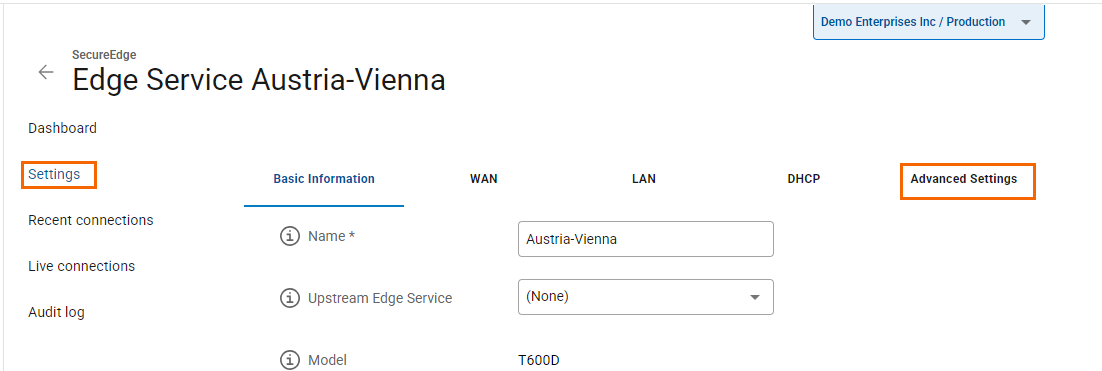
  6. In the private edge service menu, go to Settings > ADVANCED SETTINGS.
    ES-AdvSetting.png
  7. At the bottom of the window, click to Disable Syslog Streaming.
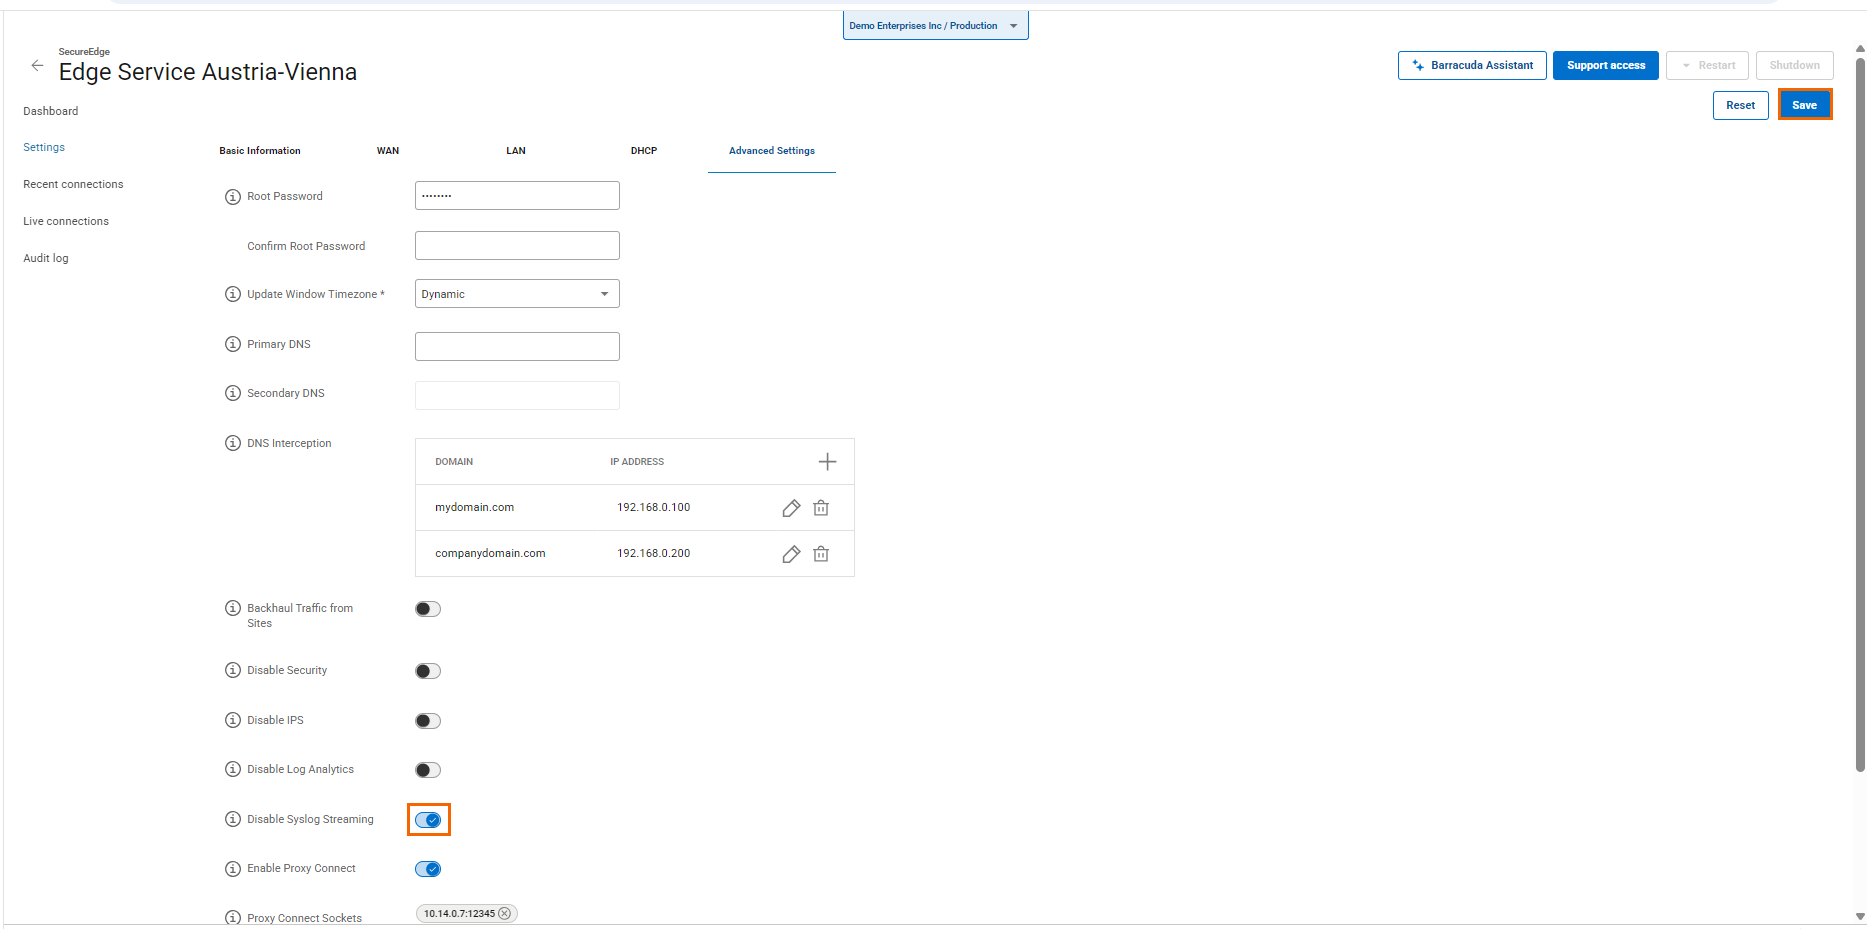
    PES-Syslog-Disable.png
  8. Click Save.

Disable Syslog Streaming for Edge Service for VWAN 

You can disable syslog streaming for a specific edge service for VWAN:

  1. Go to https://se.barracudanetworks.com and log in with your existing Barracuda Cloud Control account.
  2. In the left menu, click the Tenants/Workspaces icon and select the workspace containing your edge service for VWAN.
  3. Go to Infrastructure > Edge Services
  4. The Edge services page opens. Select the edge service for VWAN you wish to disable syslog streaming for. 
  5. Click on the arrow icon next to the edge service you are interested in. The selected edge service for VWAN page opens. 
  6. In the edge service menu, click Settings.
  7. Click to Disable Syslog Streaming.
    ESVWAN-Syslog.png
  8. Click Save.