

Barracuda Networks offers a variety of reports on the Impersonation Protection Reports page. There are seven built in reports listed under Barracuda's Reports that can be manipulated by setting column filters or choosing what and how data will be displayed. Once to your liking, they can also be named and saved for future use. These customized reports can be found under My Reports.
Insights from these reports can allow you to quickly understand the threats targeting your organization. You can also use this information to make your security training more impactful.
Report data is real time, meaning it is constantly updated with the latest information.
Barracuda's Built In Reports
Found under Reports > Report list in the left navigation, these reports are designed to provide robust information about email-borne phishing, scamming, impersonation attempts, business email compromise (BEC), and cyber fraud reaching your organization.
Threats
This report shows the number of emails received by your organization over time that portray any of the fraud types (Phishing, Scamming, Impersonation, Conversation hijacking, Extortion).
Top recipients of fraudulent emails
Your organization's email addresses that received the most emails of any of the fraud types (Phishing, Scamming, Impersonation, Conversation hijacking, Extortion).
Impersonated senders
Top senders of email messages that attempt to falsely impersonate other people.
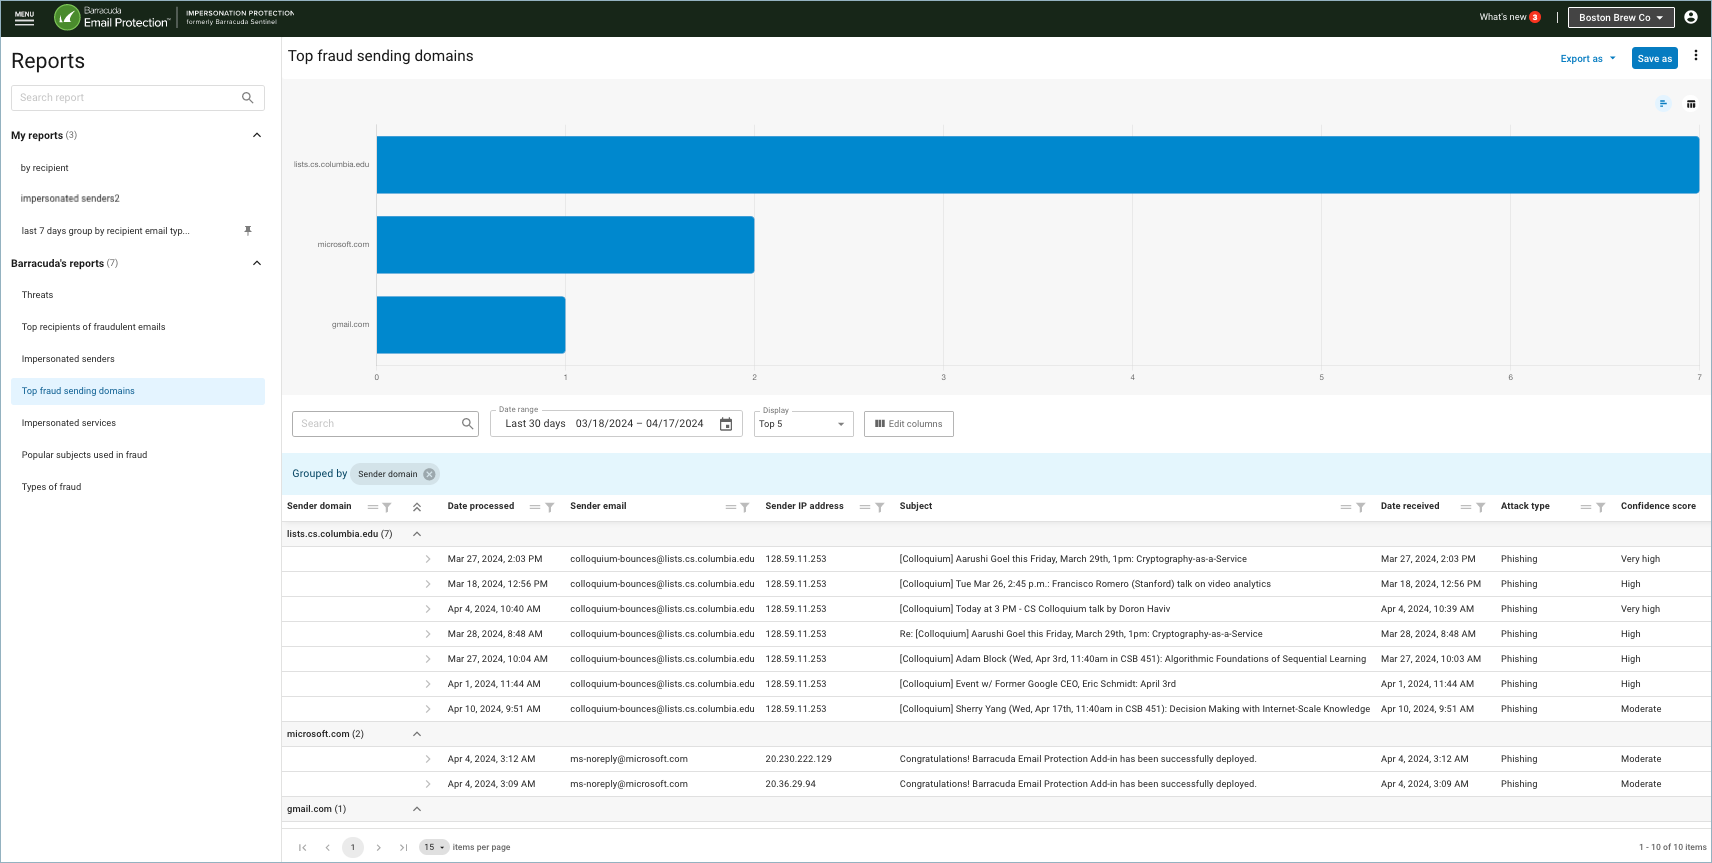
Top fraud sending domains
Top domains sending email messages of any of the fraud types (Phishing, Scamming, Impersonation, Conversation hijacking, Extortion).
Impersonated services
Online services that were most impersonated in the emails received by your organization. For example: Google, Amazon, Adobe, etc.
Popular subjects used in fraud
Top subjects of fraudulent emails received by your organization.
Types of fraud
The number of emails received of each of the fraud types (Phishing, Scamming, Impersonation, Conversation hijacking, Extortion).
Customize and Save Reports
Each report can be customized in various ways. Once a report is to your liking, you can name and save it for future use. The new report is then found in the left navigation under My Reports. Once saved, new data is displayed matching your customization.
Time format – Depending on the grouping of data (see Grouped by above), the displayed graph or chart can show data gathered Monthly, Weekly, or Daily. If this option is available it will be at the top right, under the Export as button.
![]()
Visual display format – If available with this report type, you can choose how the data will be visually represented. Clicking the desired option to see it as a bar chart, or to view it as a line graph. (See above image.)
Text search – Anything entered in the Search box below the graph will be matched against data in any of the available table columns (whether those columns are displayed or not).
![]()
Date range – Click the calendar icon![]() and select from the left side of the popup to view data from the Last 24 hours, Last 7 days, Last 30 days, Last 90 days, or Last 6 months. Or use the calendar displays in the popup to choose the start and end date of any period in the last 6 months.
and select from the left side of the popup to view data from the Last 24 hours, Last 7 days, Last 30 days, Last 90 days, or Last 6 months. Or use the calendar displays in the popup to choose the start and end date of any period in the last 6 months.
Top number – (Not available for all report types.) The Display dropdown is available for reports showing "Top" metrics. Limit the data in the chart by selecting Top 5, Top 10, or Top 15.
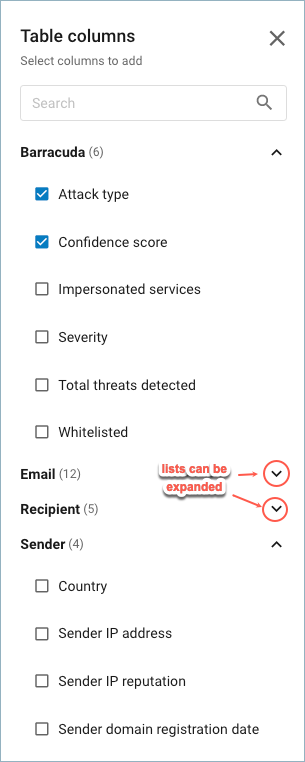
Edit columns displayed – Click the Edit columns button to select or deselect the columns to display in the table below. A flyout appears on the right side of the screen. Check or uncheck boxes to make your selections. Enter a column name in the search box to quickly find or limit column options.
Grouping table data – This is a powerful way to organize information in the data table. The light blue horizontal bar shows the current grouping. If no grouping is in effect, it will read "Drag a column header and drop it here to group by that column."
To create grouping, click on the ![]() icon over one of the table columns and drag it into the light blue bar. The table will then reorganize to fit the new grouping.
icon over one of the table columns and drag it into the light blue bar. The table will then reorganize to fit the new grouping.
In the example below, data is initially grouped by Confidence score, meaning all data is gathered and displayed for each threat level certainty. The first threat level is high and all email fitting that classification is displayed before moving on to another confidence level (regardless of any secondary groupings).
Sender email has been added for secondary grouping. Here all data is grouped first by Confidence score and within each of those they are then sub-grouped by Sender email. (This is why the sender email address
colloquium-bounces@lists.cs.columbia.edu appears in two places – confidence high and confidence moderate.)
You can add or delete groupings at will. To remove a grouping, simply click on the X on a grouping chip in the light blue bar. Grouping can also be removed by clicking on the filter icon![]() for a column and then clicking Ungroup... at the bottom of the filter window. (See Column filtering below.)
for a column and then clicking Ungroup... at the bottom of the filter window. (See Column filtering below.)
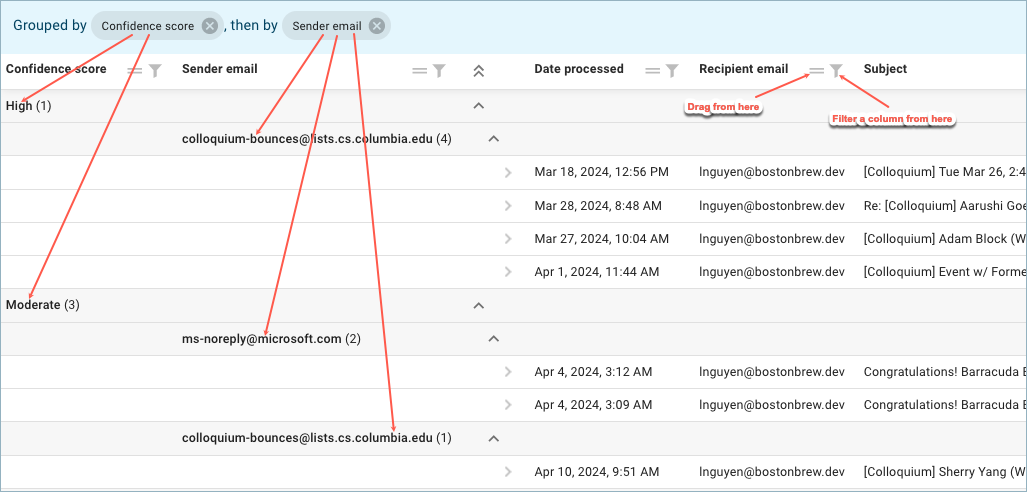
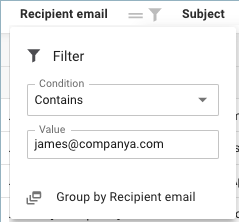
Column filtering – You can also add filtering to individual columns. Click on the filter icon![]() to see and use filter options.
to see and use filter options.
Saving a customized report – Once you have customized a report to show table and graph data to your liking, click the Save as button at top right. Then in the popup box, enter a name and click Save. Your new report can be found under My reports in the left side navigation. Clicking on the pin icon ![]() will make that your default report and it will be displayed each time you return to Impersonation Protection Reports.
will make that your default report and it will be displayed each time you return to Impersonation Protection Reports.
Other Report Features
Export – Click Export as and then select Data CSV to export all data available in the table columns in CSV (Comma Separated Value) format. Click Export as and select Summary PDF to create a PDF of the displayed graph. Note: the maximum number of lines that can be exported is 10,000.
Schedule report creation – In the main navigation at top-left, go to Reports > Scheduled reports. Scheduled Reports allows you to select when a report will be generated. For example, you can choose to have the Impersonated senders report covering the last 24 hours run each morning. Learn more.
Set a default report – Click on a report in the left navigation. Once highlighted, click again on the pin icon ![]() to make that the default report. Afterwards, whenever you return to Impersonation Protection Reports, it will automatically be displayed. It can be one of the built in Barracuda's reports or one you have customized and saved in My reports.
to make that the default report. Afterwards, whenever you return to Impersonation Protection Reports, it will automatically be displayed. It can be one of the built in Barracuda's reports or one you have customized and saved in My reports.