

- Elasticsearch is used for search and data analytics
- Logstash is used for centralized logging and parsing
- Kibana is used for data visualizations
This article provides details on how to set up the ELK version 7.2.0 with the Barracuda Web Application Firewall. This integration allows administrators to search and visualize the logs generated by the Barracuda Web Application Firewall systems on ELK.
Step 1: Set up the ELK Stack
Installing the ELK Stack
You can install each of these tools either on different servers/virtual machines or on a single instance. You can also configure them to communicate with your existing applications. For more information on how to install and deploy the ELK Stack, refer to the Elastic website.
A single node ELK deployment running Ubuntu 16.04 server LTS is shown below as an example.
Installing NGinx to front-end Kibana
By default, Kibana runs on 5601. NGinx can be used to proxy this traffic and expose the Kibana UI on port 80.
sudo apt install nginx

sudo apt install apt-transport-https
Installing Java JRE
Java is a prerequisite for running Logstash and must be installed on the server.
sudo apt install default-jreDownloading ELK v7.x Latest
wget -qO - https://artifacts.elastic.co/GPG-KEY-elasticsearch | apt-key add -

echo "deb https://artifacts.elastic.co/packages/7.x/apt stable main" | sudo tee -a /etc/apt/sources.list.d/elastic-7.x.list
Installing ELK
sudo apt-get update && sudo apt-get install logstash && sudo apt-get install elasticsearch && sudo apt-get install kibanaConfiguring NGINX
Set up the NGinx conf file under /etc/nginx/sites-available/default as follows:
server {
	listen 80 default_server;
	listen [::]:80 default_server;
	server_name _;

	location / {
		# First attempt to serve request as file, then
		# as directory, then fall back to displaying a 404.
	proxy_pass http://127.0.0.1:5601/;
	}
}
Configuring Logstash
Logstash pipeline processing is configured through a pipeline configuration file and is placed in the default location /etc/logstash/conf.d/. The file includes input, output, and filter elements to ensure that the Barracuda Web Application Firewall logs are processed by Logstash and sent to the Elasticsearch system. It also allows Elasticsearch to create separate indexes for web firewall logs, access logs, audit logs, system logs, and network firewall logs.
| Type of Log | Index Name |
|---|---|
| Web Firewall Logs (WF) | web_firewall_logs |
| Access Logs (TR) | access_logs |
| Audit Logs (AUDIT) | audit_logs |
| Audit Logs (AUDIT) | audit_logs |
| Network Firewall Logs (NF) | network_firewall_logs |
The configuration file is downloaded from "waf.conf". Move the ‘waf.conf’ file to /etc/logstash/conf.d/ location.
The Logstash pipeline configuration file "waf.conf" includes a file output section that is used for debugging or related tasks. Any logs sent by the Barracuda Web Application Firewall should be appended to this file. Create this output file under the location /home/logstash/ and name the file as "output.txt". Ensure that the file has WRITE permissions.
Restart Logstash
service logstash restartConfiguring Elasticsearch
Create Index Template for Creating the GEOIP Mapping
curl -X PUT http://127.0.0.1:9200/_templates/web_firewall_logs -H 'Content-Type:application/json' -d '{
  "template":"*web_firewall_log*",
  "settings": {
    "number_of_replicas": 1,
    "number_of_shards": 2
  },
  "mappings": {
   "properties": {
   "geoip": {
          "dynamic": true,
          "properties": {
            "location": {
              "type": "geo_point"
            }
          }
        }

   }
  }

}'
Alternatively, the request is sent from the devtools section within the Kibana UI.
PUT _template/web_firewall_logs
{
  "web_firewall_logs" : {
    "order" : 0,
    "index_patterns" : [
      "*web_firewall_log*"
    ],
    "settings" : {
      "index" : {
        "number_of_shards" : "2",
        "number_of_replicas" : "1"
      }
    },
    "mappings" : {
      "properties" : {
        "geoip" : {
          "dynamic" : true,
          "properties" : {
            "location" : {
              "type" : "geo_point"
            }
          }
        }
      }
    },
    "aliases" : { }
  }
}
Configuring Kibana
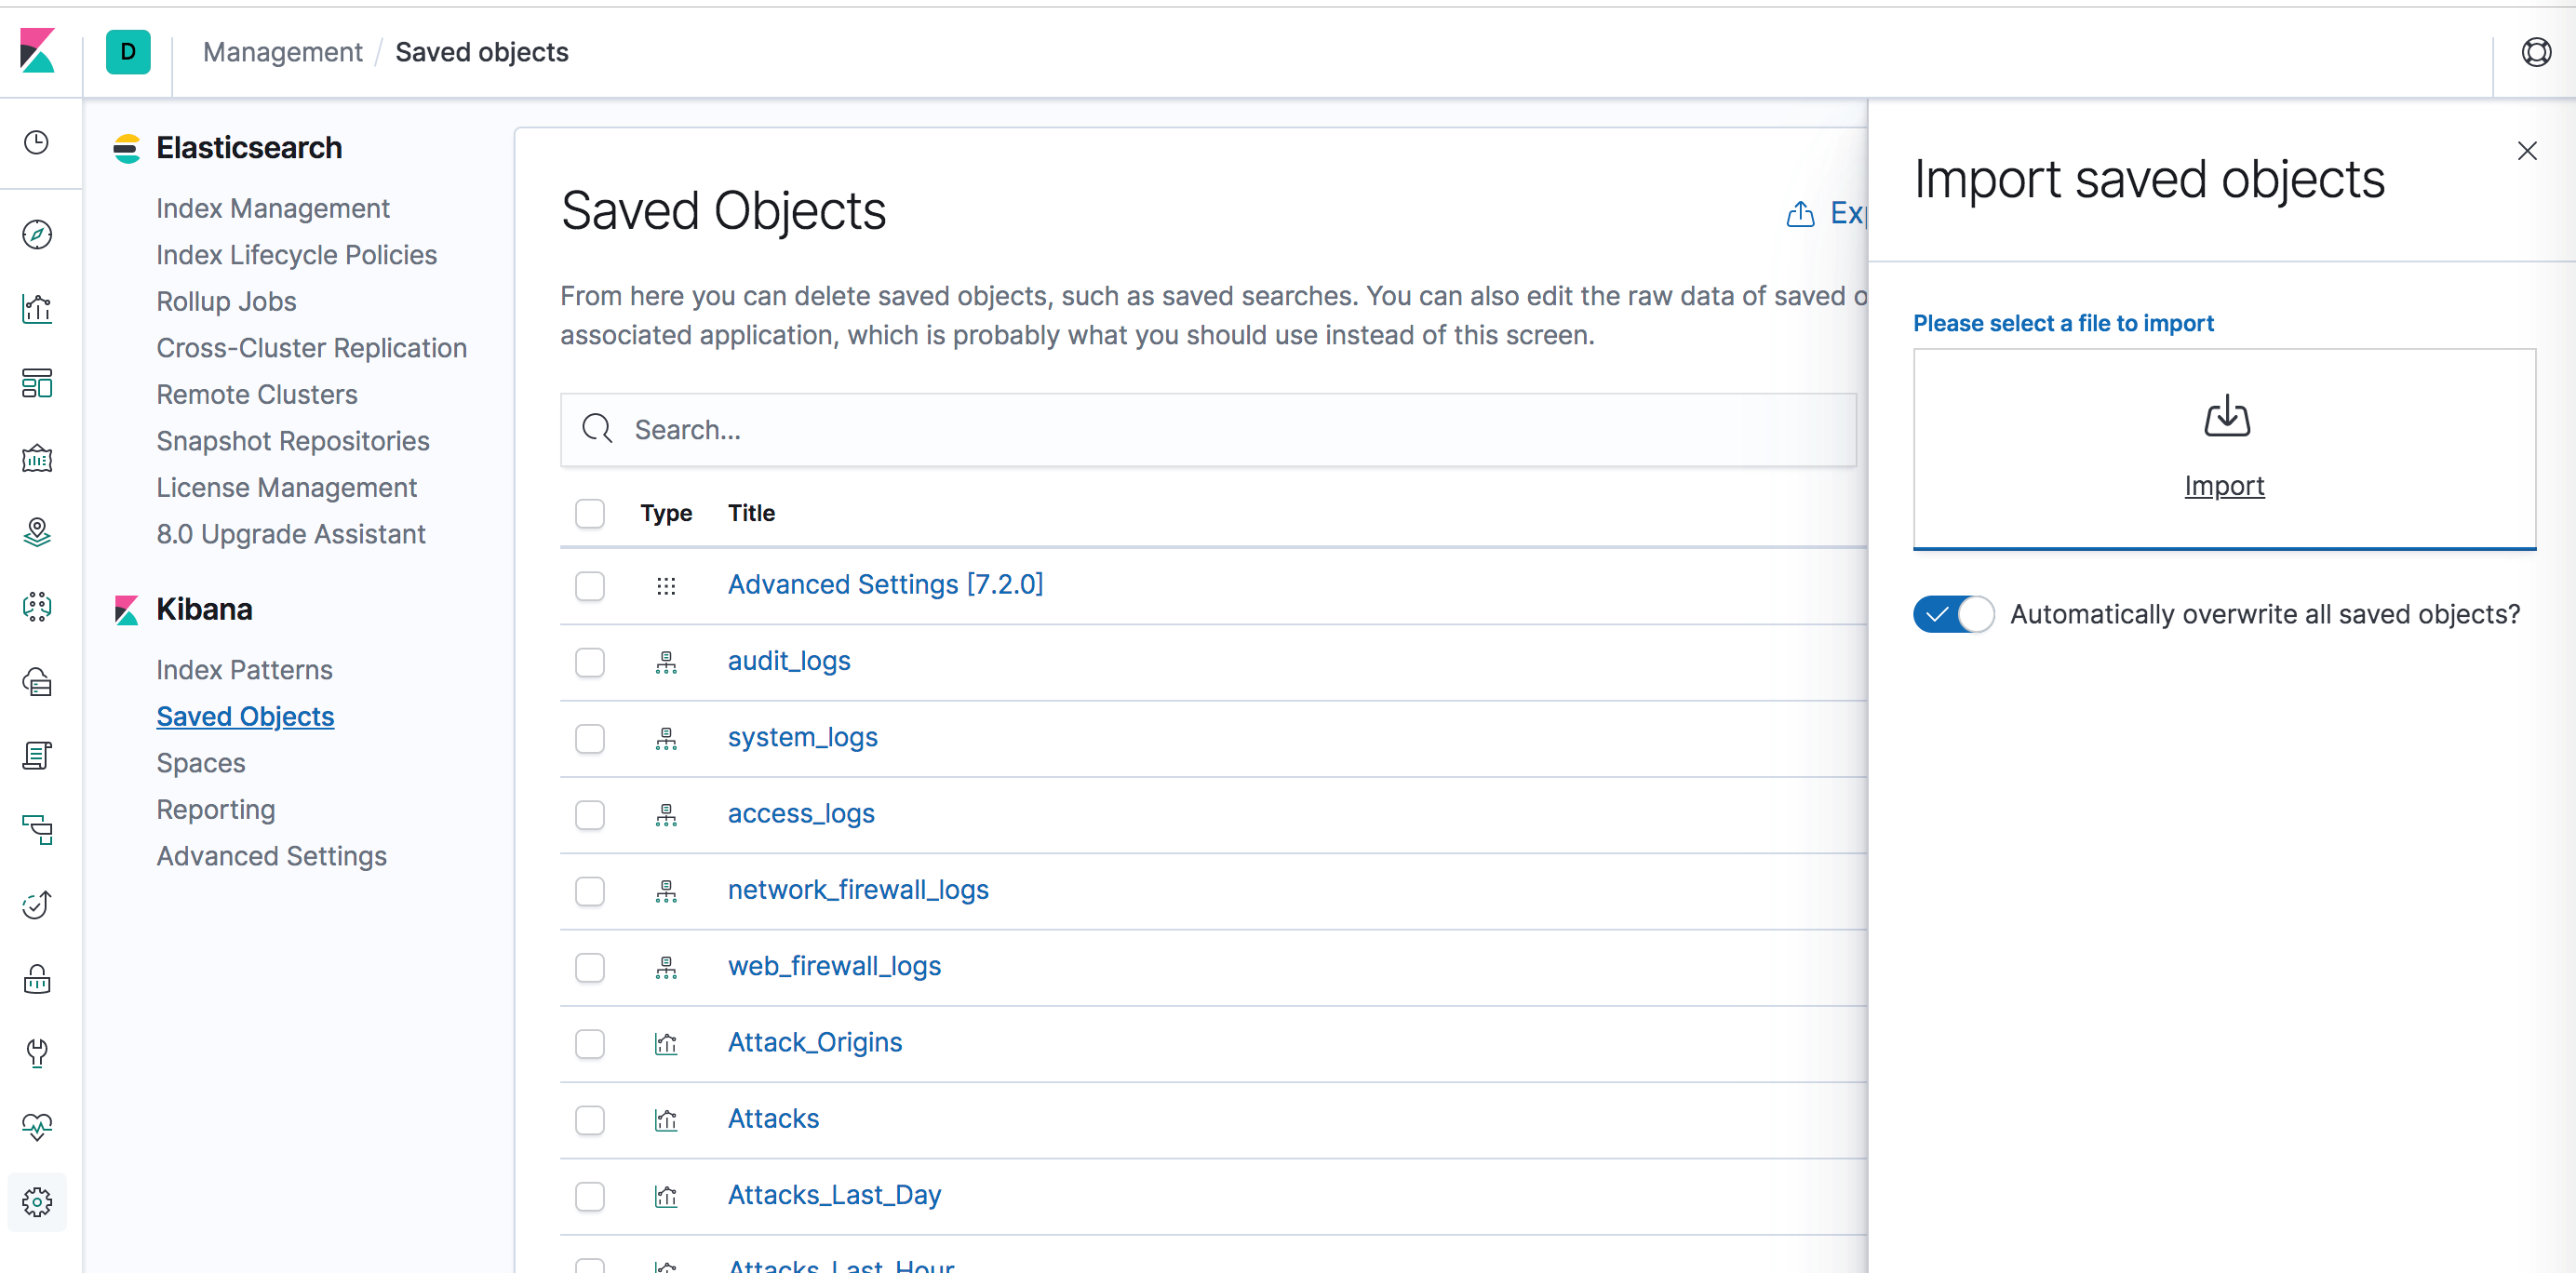
Kibana Visualizations are used to create visualization graphs and dashboards for better visibility of the logs. Administrators create Kibana visualizations using the newline delimited JSON file that is downloaded from "kibana.ndjson"
- Log into the Kibana web interface.
- Navigate to Management > Saved Objects and then upload this file.
Restart ELK services
service logstash restart

service elasticsearch restart

service kibana restart

service nginx restart
Verify that all the following services are running:
- Logstash listens on UDP 1514
- Elasticsearch listens on TCP 9200
- Kibana listens on TCP 5601
- NGINX listens on port 80
ubuntu@ip-192-168-10-19:~$ netstat -anpe --udp
(Not all processes could be identified, non-owned process info
 will not be shown, you would have to be root to see it all.)
Active Internet connections (servers and established)
Proto Recv-Q Send-Q Local Address           Foreign Address         State       User       Inode       PID/Program name
udp        0      0 0.0.0.0:1514            0.0.0.0:*                           999        58196       -
udp        0      0 0.0.0.0:68              0.0.0.0:*                           0          11146       -
ubuntu@ip-192-168-10-19:~$ netstat -anpe | grep "LISTEN" | grep tcp
(Not all processes could be identified, non-owned process info
 will not be shown, you would have to be root to see it all.)
tcp        0      0 127.0.0.1:5601          0.0.0.0:*               LISTEN      113        59047       -
tcp        0      0 0.0.0.0:80              0.0.0.0:*               LISTEN      0          57937       -
tcp        0      0 0.0.0.0:22              0.0.0.0:*               LISTEN      0          37086       -
tcp6       0      0 127.0.0.1:9600          :::*                    LISTEN      999        58198       -
tcp6       0      0 127.0.0.1:9200          :::*                    LISTEN      112        58060       -
tcp6       0      0 ::1:9200                :::*                    LISTEN      112        59638       -
tcp6       0      0 :::80                   :::*                    LISTEN      0          57938       -
tcp6       0      0 127.0.0.1:9300          :::*                    LISTEN      112        59588       -
tcp6       0      0 ::1:9300                :::*                    LISTEN      112        59581       -
tcp6       0      0 :::22                   :::*                    LISTEN      0          37088       -
Step 2: Configure the Barracuda Web Application Firewall to Send Logs to Logstash Service
Perform the following steps to configure the Barracuda Web Application Firewall:
- Log into the Barracuda Web Application Firewall web interface.
- Go to the ADVANCED > Export Logs page.
- In the External Log Servers section, click Add Log Server.
- In the Add Syslog Server page, edit the following settings:
- Name– Enter a name for the export log server.
- Log Server Type – Select Syslog NG .
- IP Address or Hostname– Enter the IP address or the hostname of the Logstash or ELK server.
- Port– Enter the port number associated with the IP address of the Logstash or ELK server. By default, Logstash listens on port 1514 over UDP.
- Specify values for other parameters as required and click Add.
- In the Logs Format section, edit the following settings:
- Syslog Header – Select ArcSight Log Header.
- Web Firewall Logs Format – Select Custom Format and add the log format given below:
%header LogType=%lt ServiceIP=%ai ServicePort=%ap Action=%at AttackDetails=%adl AuthenticatedUser=%au ClientIP=%ci ClientPort=%cp Method=%m Protocol=%p Referer=%r StartTime=%ta DeviceReceiptTime=%tarc URL=%u UserAgent=%ua UnitName=%un EventID=%uid ProxyPort=%pp RuleID=%ri FollowUpAction=%fa RuleType=%rt AttackGroup=%ag ProxyIP=%px SessionID=%sid- Access Logs Format – Select Custom Format and add the log format given below:
%header ServiceIP=%ai AuthenticatedUser=%au BytesReceived=%br BytesSent=%bs CertificateUser=%cu ClientIP=%ci ClientPort=%cp Cookie=%c WAF_Host=%h HTTPStatus=%s LoginID=%id LogType=%lt Method=%m Protocol=%p QueryString=%q Referer=%r ServerIP=%si ServerPort=%sp DeviceReceiptTime=%tarc StartTime=%ta URL=%u UserAgent=%ua UnitName=%un EventID=%uid ClientType=%ct Protected=%pf ProxyIP=%px ProfileMatched=%pmf WFMatched=%wmf ServicePort=%ap CacheHit=%ch ProxyPort=%pp ServerTime=%st TimeTaken=%tt ProtocolVersion=%v CustomHeader1=%cs1 CustomHeader2=%cs2 CustomHeader3=%cs3 ResponseType=%rtf SessionID=%sid- Audit Logs Format – Select Custom Format and add the log format given below:
%header LogType=%lt ObjectName=%on ObjectType=%ot AdminName=%an ClientType=%ct CommandName=%cn LoginIP=%li LoginPort=%lp DeviceReceiptTime=%tarc EventMessage=%add ChangeType=%cht UnitName=%un StartTime=%ta TransactionID=%tri NewValue=%nv OldValue=%ov Variable=%var EventID=%uid AdminRole=%a- Network Firewall Logs Format– Select Custom Format and add the log format given below:
%header LogType=%lt SourceIP=%srci SourcePort=%srcp DestinationIP=%di DestinationPort=%dp ActionID=%act StartTime=%ta UnitName=%un Protocol=%p DeviceReceiptTime=%tarc Details=%dsc EventID=%uid- System Logs Format: Select Custom Format and add the log format given below:
%header LogType=%lt DeviceReceiptTime=%tarc EventID=%uid EventMessage=%ms UnitName=%un StartTime=%ta6. Click Save.
With the above configuration, the Barracuda Web Application Firewall will start to send the log events to Logstash. This can be verified by checking the output file, for example, output.txt, under /home/logstash/ on the ELK server.
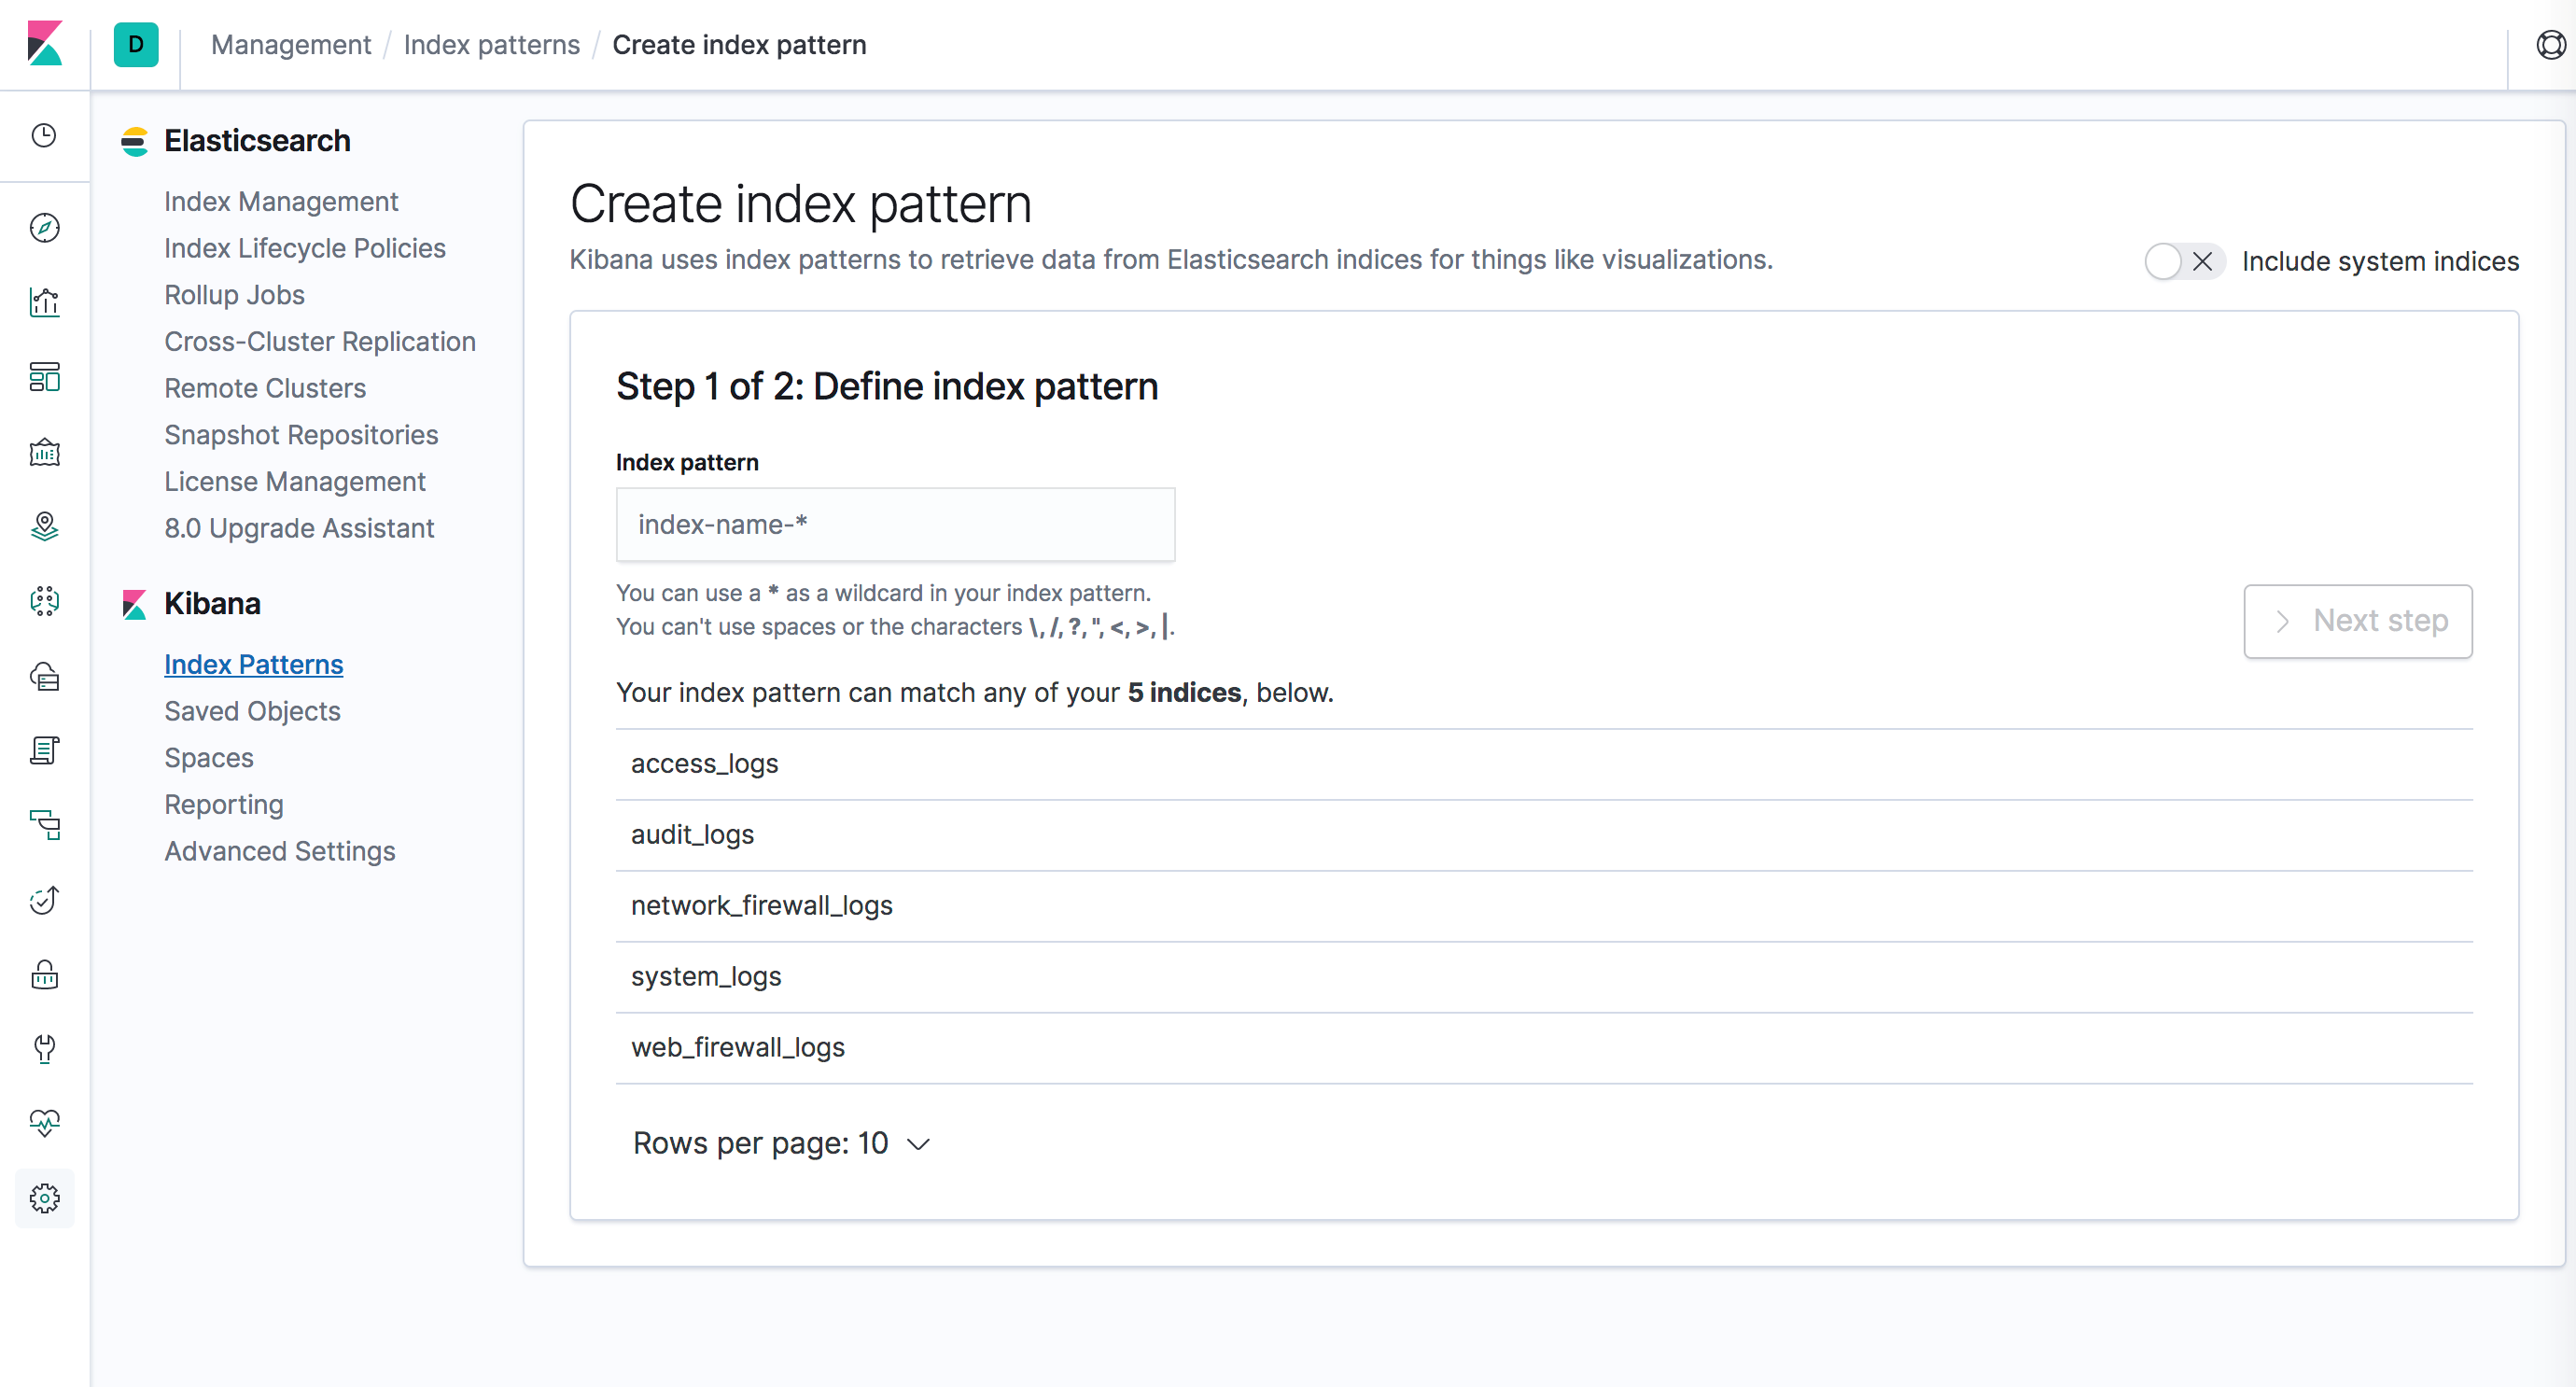
Step 3: Create the Index Patterns
- Login into the Kibana user interface.
- Navigate to the Management section, and then click Index Patterns.
- Create index patterns for each of the WAF log types.
Step 4: Access the Kibana Web Interface to View the Logs
- Kibana can be accessed through NGINX at http://<server>/app/kibana . The Discover tab displays the logs in detail.
- Navigate to Visualize and the Dashboard tabs to view the following nine saved visualizations:
- Attack_Origins: Displays the geographical location from where the attacks originated.
- Attacks: Displays the attack type and the total count for the attack type in the selected time frame.
- Attacks_Last_Day: Displays all attack types and the count for all attacks in the last day.
- Attacks_Last_Hour: Displays all attack types and the count for all attacks in the last hour.
- Response_Time_Graph: Displays the average response time taken by each service.
- Top_Attacked_Domains: Displays the count of top attacked domains based on the number of times each service has been attacked.
- Top_Attacked_URLs: Displays the count of top attacked URLs based on the number of times each URL has been attacked.
Points to Remember
- By default, Elasticsearch and Kibana are configured to listen on localhost, which should be configured in 'elasticsearch.yml' and 'kibana.yml' as per the requirements.
- By default, Elasticsearch listens on port 9200 with tcp6 protocol for IPv6. In case of IPv4, add the following line in the /etc/elasticsearch/jvm.options file and restart Elasticsearch: Djava.net.preferIPv4Stack=true