The Simple Network Management Protocol (SNMP) is an Internet standard protocol that provides a method for managing network devices such as servers, workstations, routers, hubs, and bridges from a centrally located host running network management software. The Barracuda Web Application Firewall supports the following SNMP versions: SNMP v2c and SNMP v3.
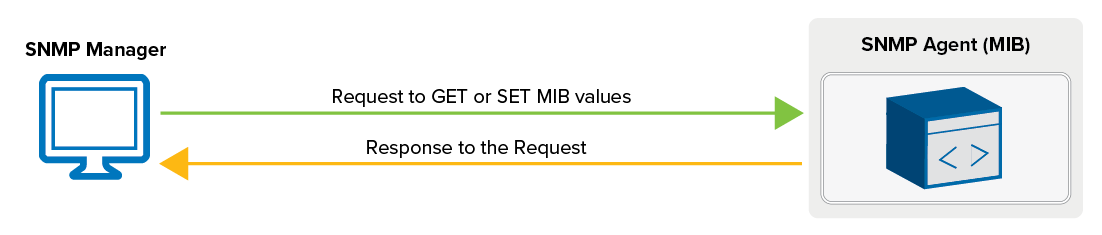
A standard SNMP implementation includes three key components:
- SNMP Manager – software that runs on a management system and makes SNMP queries to a device. This managing system is called a Network Management System (NMS).
- SNMP Agent – software that runs on the managed device that maintains data for the device and responds to the SNMP queries/requests.
- Management Information Base (MIB) – a virtual repository for network management information that consists of a set of managed objects. These objects are organized in a hierarchical tree structure. Each object within the MIB tree has a unique object ID (OID), written as a series of integers.
The SNMP agent contains MIB variables, and the values of these variables can be requested by the SNMP manager through Get operations.
SNMP Configuration on the Barracuda Web Application Firewall
Before the Barracuda Web Application Firewall can be managed remotely by the system running SNMP Manager, perform the following tasks:
- Configure the SNMP agent
- Download the MIB files to your remote manager system. See the section "Downloading SNMP MIB Files" below.
Once the above tasks are performed, you can execute the SNMP commands on the network management system to manage the Barracuda Web Application Firewall.
Configuring the SNMP Agent
To configure the SNMP agent on the Barracuda Web Application Firewall, perform the following tasks:
- Configure Client Access to the SNMP Agent
Configure the Barracuda Web Application Firewall to allow access to the SNMP agent from an SNMP manager system.
- Configure SNMP Traps
Specify the destination SNMP manager system for SNMP traps.
Configuring Client Access (SNMP Manager)
The system running the SNMP manager software for remotely monitoring the Barracuda Web Application Firewall is referred as an SNMP client. The Barracuda Web Application Firewall supports SNMP version v2c and v3. Version v2c and v3 allow SNMP access only from the IP address(es) configured in the Allowed SNMP IP/Range field, and version v3 restricts SNMP access to only password-authenticated users.
Allow Client Access to the SNMP Agent
- Go to the BASIC > Administration page.
- In the SNMP Manager section, specify values for the following:
- Enable SNMP Agent – Set to Yes to allow the Barracuda Web Application Firewall to accept and respond to the SNMP queries.
- SNMP Version – Select the SNMP version (v2c or v3) to be used.
- v2c - Allows SNMP access only to the IP address(es) configured in the Allowed SNMP IP/Range field.
- SNMP Community String – Specify the community string, or password for authenticating SNMP access.
As a best practice, use a unique account for this integration point and grant it the least level of privileges required, coordinating with the SNMP administrator. For additional information, see Security for Integrating with Other Systems - Best Practices .
- SNMP Community String – Specify the community string, or password for authenticating SNMP access.
- v3 – Encrypts the SNMP traffic and limits access to only password-authenticated users.
- User – Enter a name to be used for authenticating SNMP v3 queries.
Password – Enter the password to be used for the specified user.
As a best practice, use a unique account for this integration point and grant it the least level of privileges required, coordinating with the SNMP administrator. For additional information, see Security for Integrating with Other Systems - Best Practices .- Authentication Method – Select the authentication method (MD5, SHA, or SHA-256) supported by your SNMP monitor. Note: SHA-256 provides a higher level of security.
- Encryption Method – Select the encryption method (DES, AES, or AES-256) supported by your SNMP monitor. Note: AES-256 provides a higher level of security.
- v2c - Allows SNMP access only to the IP address(es) configured in the Allowed SNMP IP/Range field.
- Allowed SNMP IP/Range – Specify the IP address(es) for which SNMP access needs to be allowed to connect to the Barracuda Web Application Firewall.
- Click Save Changes.
Configuring SNMP Traps
Traps are unsolicited notification messages generated by the Barracuda Web Application Firewall and sent to the SNMP manager when significant events occur on the Barracuda Web Application Firewall. These notification messages are sent only to the IP address(es) configured in the Trap Receivers section on the BASIC > Administration page.
The Barracuda Web Application Firewall can generate SNMP alerts for the following events:
| Alert | tempCritical | System temperature exceeded its threshold. { bwstraps 3 } |
|---|---|---|
firmwareStorageHigh | Firmware storage exceeds 85%. | |
logStorageHigh | Log storage exceeds 85%. | |
raidDegrading | One of the RAID arrays is degrading. | |
| energizeUpdateExpire | Energize Updates subscription is about to expire. | |
firmwareUpdateAvailable | New Firmware Update is available. | |
attackDefinitionUpdateAvailable | New Attack Definition is available. | |
| Critical | tempHigh | System temperature is higher than 80 C. |
| systemFailOver | System has failed over. | |
| Warning | switchingToMaintMode | System is in failed state. |
| Error | fanDead | One of the system fans is dead. |
dataPortLinkDown | Data link is down. | |
serverDown | Backend server is down. | |
peerDown | Peer is down. | |
| Information | dataPortLinkUp | Peer is up. |
serverUp | Backend server is up. | |
peerUp | Peer is up. | |
switchingToBypassMode | Switching to bypass mode. |
Downloading SNMP MIB Files
A MIB file contains a set of definitions for each managed object. It defines the data type, accessibility, description, and the current validity of the object. The Barracuda Web Application Firewall provides two MIB files that can be downloaded and imported to your SNMP manager.
Download the MIB Files
- Go to the BASIC > Administration page, and click Help.
- Scroll down to the SNMP Manager section, click the link The Barracuda Web Application Firewall MIB, and save the Barracuda-BWS-MIBS.tar file.
SNMP Table and Statistics
An SNMP table is an ordered collection of objects. Each row contains one or more objects, and each object in a table is identified using the table index. The Barracuda Web Application Firewall contains 50 object identifiers in the SNMP table.
The following table displays the statistics polled for the SNMP tables:
| Stats Name | Description | OID | Example |
|---|---|---|---|
| bwsHttpProxyStatsTable | Table to show statistics for the HTTP services configured on the Barracuda Web Application Firewall. | 1.3.6.1.4.1.20632.8.50.1 | snmpwalk -v 2c -c public 10.11.31.231 .1.3.6.1.4.1.20632.8.50.1 |
| bwsSslProxyStatsTable | Table to show statistics for the HTTPS services configured on the Barracuda Web Application Firewall. | .1.3.6.1.4.1.20632.8.50.2 | snmpwalk -v 2c -c public 10.11.31.231 .1.3.6.1.4.1.20632.8.50.2 |
| bwsCompressionStatsTable | Table to show statistics for the HTTP compression feature if it is enabled for a given service. | .1.3.6.1.4.1.20632.8.50.3 | snmpwalk -v 2c -c public 10.11.31.231 .1.3.6.1.4.1.20632.8.50.3 |
| bwsCacheStateTable | Table to show statistics for the HTTP caching feature if it is enabled for a given service. | .1.3.6.1.4.1.20632.8.50.4 | snmpwalk -v 2c -c public 10.11.31.231 .1.3.6.1.4.1.20632.8.50.4 |
| bwsHttpSrvrStatsTable | Table to show statistics for the HTTP server configured for a virtual IP address. | 1.3.6.1.4.1.20632.8.50.5 | snmpwalk -v 2c -c public 10.11.31.231 .1.3.6.1.4.1.20632.8.50.5 |
| bwsSslSrvrStatsTable | Table to show statistics for the HTTPS server configured for a virtual IP address. | .1.3.6.1.4.1.20632.8.50.6 | snmpwalk -v 2c -c public 10.11.31.231 .1.3.6.1.4.1.20632.8.50.6 |
| bwsIpsLrnSrvcStatsTable | Table to show profiles created by adaptive profiling and learning. Also, profiles that are updated by responses. | .1.3.6.1.4.1.20632.8.50.8 | snmpwalk -v 2c -c public 10.11.31.231 .1.3.6.1.4.1.20632.8.50.8 |
| bwsIpsReqLimitStatsTable | Table to show statistics for the Request Limits feature for a given security policy. | .1.3.6.1.4.1.20632.8.50.9 | snmpwalk -v 2c -c public 10.11.31.231 .1.3.6.1.4.1.20632.8.50.9 |
| bwsIpsUrlNormStatsTable | Table to show statistics for the URL Normalization feature for a given security policy. | .1.3.6.1.4.1.20632.8.50.10 | snmpwalk -v 2c -c public 10.11.31.231 .1.3.6.1.4.1.20632.8.50.10 |
| bwsIpsCookieSecStatsTable | Table to show statistics for the Cookie Security feature for a given security policy. | .1.3.6.1.4.1.20632.8.50.11 | snmpwalk -v 2c -c public 10.11.31.231 .1.3.6.1.4.1.20632.8.50.11 |
| bwsIpsUrlAclStatsTable | Table to show statistics for the URL ACL feature for a given service. | .1.3.6.1.4.1.20632.8.50.12 | snmpwalk -v 2c -c public 10.11.31.231 .1.3.6.1.4.1.20632.8.50.12 |
| bwsIpsHdrAclStatsTable | Table to show statistics for the header ACL feature for a given service. | .1.3.6.1.4.1.20632.8.50.13 | snmpwalk -v 2c -c public 10.11.31.231 .1.3.6.1.4.1.20632.8.50.13 |
| bwsIpsWebAddrTransStatsTable | Table to show web address translation feature for a given service. | .1.3.6.1.4.1.20632.8.50.14 | snmpwalk -v 2c -c public 10.11.31.231 .1.3.6.1.4.1.20632.8.50.14 |
| bwsIpsAccessCtrlStatsTable | Table to show statistics for the access control feature for a given service. | .1.3.6.1.4.1.20632.8.50.15 | snmpwalk -v 2c -c public 10.11.31.231 .1.3.6.1.4.1.20632.8.50.15 |
| bwsIpsRCStatsTable | Table to show statistics for the rate control feature for a given service. | .1.3.6.1.4.1.20632.8.50.16 | snmpwalk -v 2c -c public 10.11.31.231 .1.3.6.1.4.1.20632.8.50.16 |
| bwsIpsUrlPolicyStatsTable | Table to show statistics for the URL policy for a given service. | .1.3.6.1.4.1.20632.8.50.17 | snmpwalk -v 2c -c public 10.11.31.231 .1.3.6.1.4.1.20632.8.50.17 |
| bwsServiceStatusTable | Table to show the service IP/Port and status of service OID | .1.3.6.1.4.1.20632.8.50.19 | snmpwalk –v 3c –c public 10.11.31.231 .1.3.6.1.4.1.20632.8.50.19 |
Using SNMP
Collecting Performance Data
The types of performance data that can be gathered using SNMP on the Barracuda Web Application Firewall are as follows:
- Memory use
- Number of active connections per service
- Number of HTTP requests per service
- Number of SSL transactions per service
Each performance data type is associated with one or more SNMP object IDs (OIDs). To gather performance data, specify the OIDs with the appropriate SNMP command.
For example, the following SNMP command collects data on current memory use, where “public” is the community name and 10.11.31.231 is the IP address of the Barracuda Web Application Firewall:
snmpget -c public –v 2c 10.11.31.231 .1.3.6.1.4.1.20632.8.19
For some types of metrics, you can just issue an SNMP command with an OID to get the needed information. Example: Memory use. Whereas, there are some types of metrics where the data collected with SNMP is not useful until a calculation is performed on it to interpret the data.
For example, to determine the throughput rate of client bits coming into the Barracuda Web Application Firewall, you must use the relevant OID:
( httpProxyInBytes (1.3.6.1.4.1.20632.8.50.1.1.14)) to take two polls at a certain interval (such as ten seconds), calculate the delta of the two polls, and then perform the following calculation on that delta value:
( <DeltaStatClientBytesIn>*8 ) / <interval>
Collecting Data on Memory Use
This section provides information on how to gather data on the number of bytes of memory currently being used on the Barracuda Web Application Firewall.
The following OIDs are required for collecting metrics on memory use:
| Description | Required SNMP OIDs |
|---|---|
Memory Usage | 1.3.6.1.4.1.20632.8.19 |
freeMem | 1.3.6.1.4.1.20632.8.24 |
| totalMem | 1.3.6.1.4.1.20632.8.23 |
Collecting Data on System Status
This section provides information on how to gather data on the number of active connections on the Barracuda Web Application Firewall.
The following OIDs are required for collecting metrics on System Status:
| Description | Required SNMP OIDs |
|---|---|
| Uptime | 1.3.6.1.4.1.20632.8.22 |
| Systemload | 1.3.6.1.4.1.20632.8.8 |
| Operational mode | 1.3.6.1.4.1.20632.8.15 |
| vipStatus | 1.3.6.1.4.1.20632.8.18 |
| Datapathstatus | 1.3.6.1.4.1.20632.8.16 |
| highAvailabilityStatus | 1.3.6.1.4.1.20632.8.14 |
| logStorage | 1.3.6.1.4.1.20632.8.13 |
| firmwareStorage | 1.3.6.1.4.1.20632.8.12 |
| currentFirmwareVersion | 1.3.6.1.4.1.20632.8.25 |
| virusDefUpdates | 1.3.6.1.4.1.20632.8.26 |
| securityDefUpdates | 1.3.6.1.4.1.20632.8.27 |
| systemSerialNumber | 1.3.6.1.4.1.20632.8.28 |
Collecting Data on System Configuration
This section provides information on how to gather and interpret data on the number of applications on the Barracuda Web Application Firewall. You can also gather info on the total servers and their status.
The following OIDs are required for polling data on new connections:
| Graph Metrics | Required SNMP OIDs |
|---|---|
| totalApplications | 1.3.6.1.4.1.20632.8.2 |
| totalServers | 1.3.6.1.4.1.20632.8.3 |
| activeServers | 1.3.6.1.4.1.20632.8.6 |
| activeApplications | 1.3.6.1.4.1.20632.8.5 |
Collecting Data on HTTP Requests for a Service
This section provides information on how to gather and interpret data on the number of current HTTP requests on the Barracuda Web Application Firewall for a given service, in terms of requests per minute.
To gather and interpret the data for this metric, you must perform some polling and calculations:
- Use the OID and perform two separate polls, at an interval of your choice.
- Calculate the delta of the two poll values.
- Perform a calculation on the OID delta.
The table below shows the OID that you must poll, retrieving two separate poll values for this OID.
Required OIDs for polling data on HTTP requests:
| Graph Metrics | Required SNMP OIDs |
|---|---|
| HTTP Request rate | .1.3.6.1.4.1.20632.8.50.1.1.6 |
For example, to collect data on HTTP requests for the HTTP Requests graph metric, follow these steps.
Poll OID httpProxyTotalReq (.1.3.6.1.4.1.3375.2.1.1.2.1.56) twice, at a 60-second interval.
This results in two values: <sysStatHttpRequests1> and <sysStatHttpRequests2>. This OID will retrieve HTTP requests for all HTTP services.
To retrieve HTTP requests for a specific service, append the IP address in the OID. Example: 1.4.99.99.102.10.80, where 1.4 is the IPv4 version, 99.99.102.10 is the service IP address, and 80 is the port number.- Calculate the delta of the two poll values:
<DeltaHttpProxyRequests> = <httpProxyTotalReq2> - <httpProxyTotalReq1> - Calculate the value of the HTTP Requests graph metric using the calculation shown in the table below, where the value of <interval> is 60.
Required calculations for interpreting metrics on HTTP requests:
Performance Graph (Configuration utility) | Graph Metrics | Required calculations for HTTP Requests |
|---|---|---|
| HTTP Requests | HTTP Requests | < DeltaHttpProxyRequests > / <interval> |
Collecting Data on SSL Transactions
This section provides information on how to gather and interpret data on SSL performance, in terms of transactions per minute.
To gather and interpret the data for this metric, you must perform some polling and calculations:
- Use the OID and perform two separate polls at an interval of your choice.
- Calculate the delta of the two poll values.
- Perform a calculation on the OID delta.
The table below shows the OID that you must poll, retrieving two separate poll values for this OID.
Required OIDs for polling for data on HTTP requests:
| Graph Metrics | Required SNMP OIDs |
|---|---|
| sslProxyTotalReq | .1.3.6.1.4.1.20632.8.50.2.1.18.1.4.99.99.102.24.443 |
For example, to collect data on HTTP requests for the HTTP Requests graph metric, follow these steps.
Poll OID sslProxyTotalReq (.1.3.6.1.4.1.20632.8.50.2.1.18) twice, at a 60-second interval.
This results in two values: <sysStatHttpRequests1> and <sysStatHttpRequests2>. This OID will retrieve HTTP requests for all HTTP Services. To retrieve HTTP requests for a specific service, append the IP address in the OID. Example: 1.4.99.99.102.24.443, where 1.4 is the IPv4 version, 99.99.102.24 is the Service IP address and 443 is the port number.- Calculate the delta of the two poll values:
<DeltasslProxyTotalReq > = < sslProxyTotalReq2> - < sslProxyTotalReq1> - Calculate the value of the HTTP Requests graph metric using the calculation shown in the table below, where the value of <interval> is 60.
Required calculations for interpreting metrics on HTTP requests
Performance Graph (Configuration utility) | Graph Metrics | Required calculations for HTTP requests |
|---|---|---|
| SSL Requests | SSL Requests | < DeltasslProxyTotalReq > / <interval> |
Practical Use of SNMP
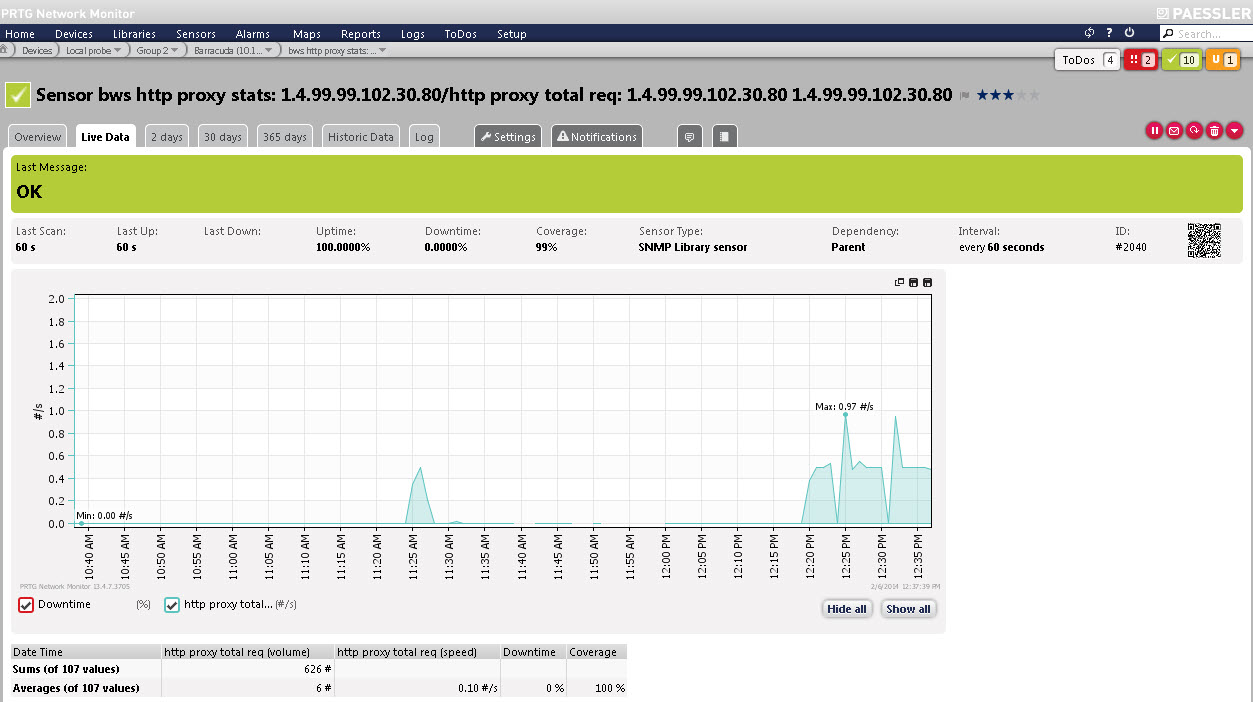
For demonstration purposes, an NMS Server (PRTG) trial version was deployed to import the MIB files of the Barracuda Web Application Firewall. SNMP settings were configured on the NMS server to generate information on the various sensors, some of which are shown below:
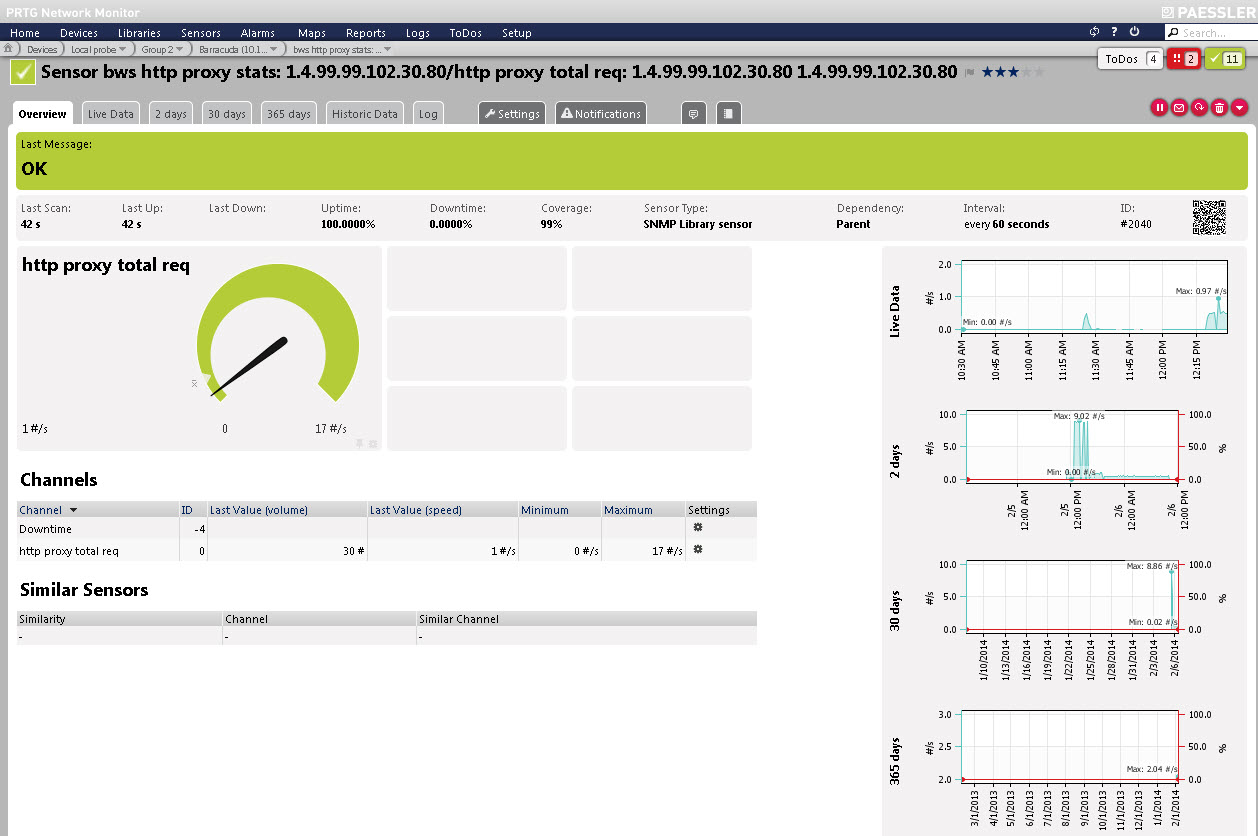
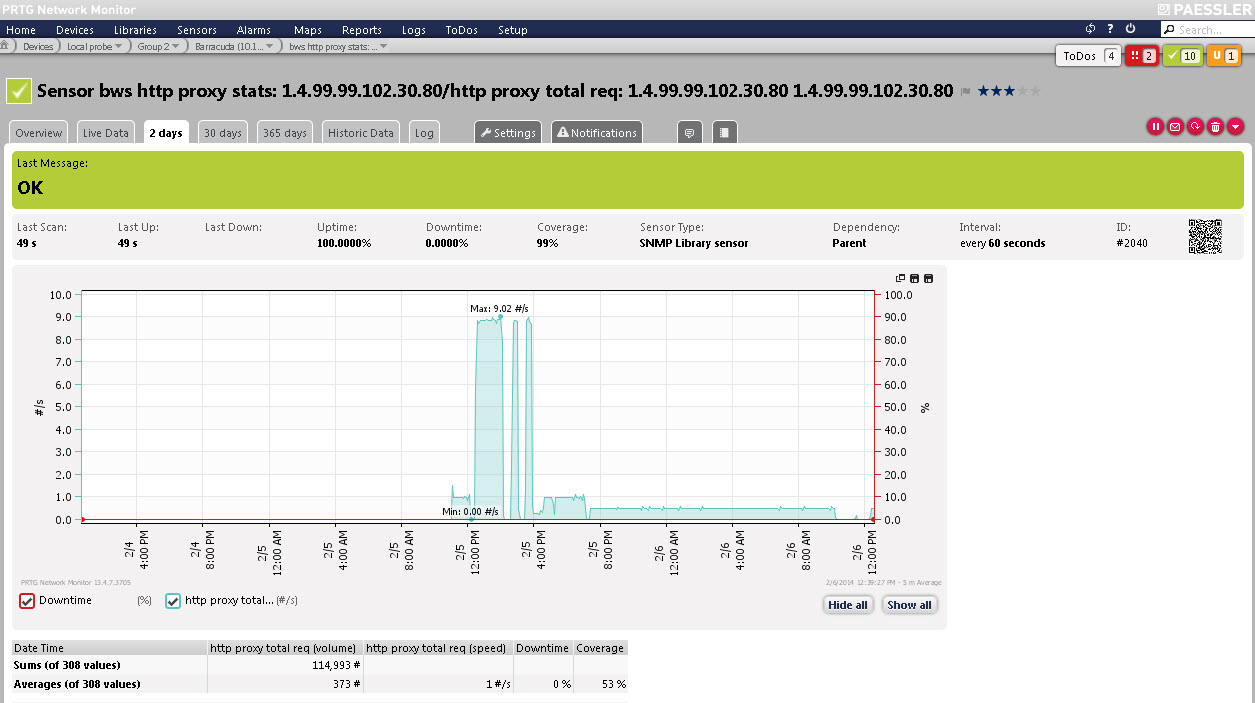
HTTP service-based statistics were collected for a period of 2 days:
Live data snapshot: