Security reports cover web attack prevention activity performed by the Barracuda Web Application Firewall. For example:
- Number of attacks for categories such as forceful browsing, XSS injections, etc., for the specified service(s) and time frame
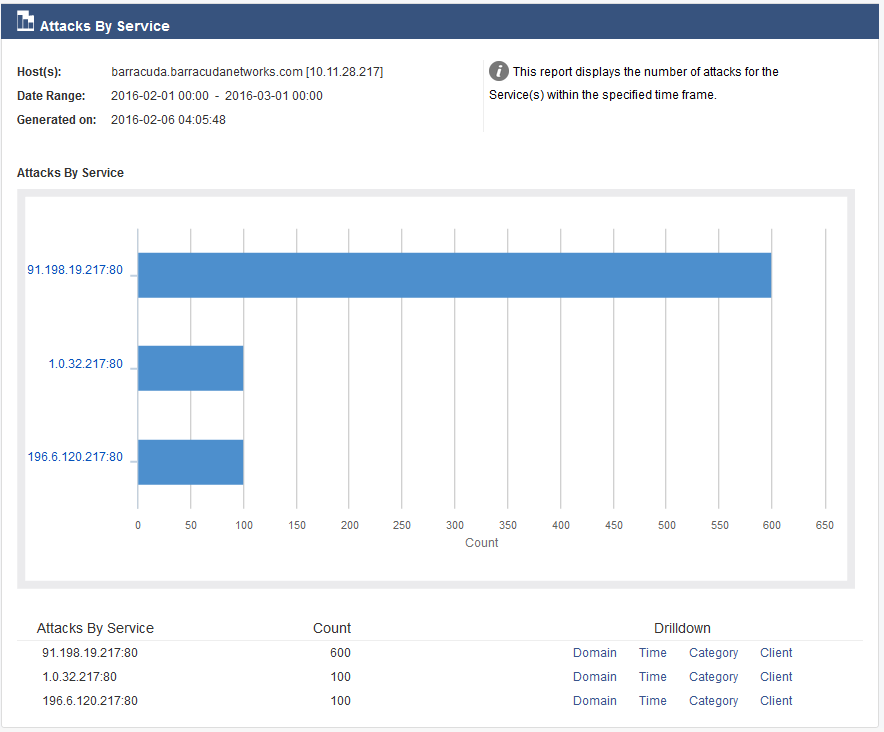
- Number of attacks on the service(s) within the specified time frame
- Number of attacks attempted during each hour of the specified day
- Top-attacked domains and URLs
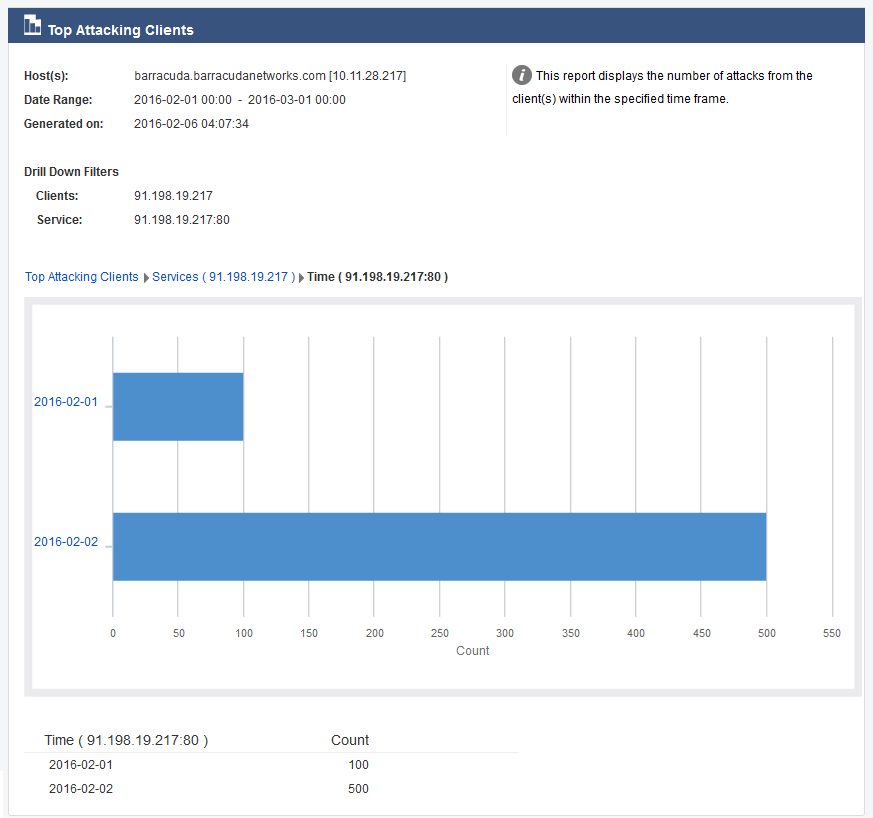
- Top-attacking clients – top clients who attacked the services
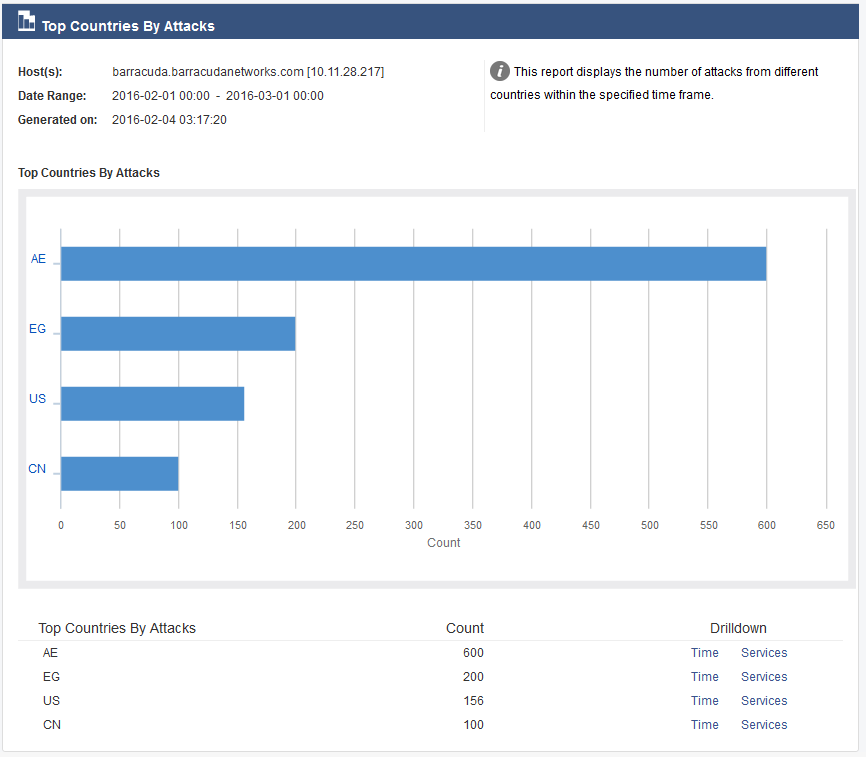
- Top attacking region/country – top countries from which the attacks were attempted
The following table provides a detailed description of each report in the Security section:
| Report Name | Report Description | Graph/Chart Type | Data in Graph/Chart | Drill Down |
|---|---|---|---|---|
| Attacks By Category | Displays the number of attacks for the categories such as forceful browsing, XSS injections, etc., for the specified service(s) and time frame. For more information on attack categories, see Attacks Description - Action Policy. The following are the attack categories displayed in the report graph:
| Bar Chart |
| Report can be drilled down by:
|
| Attacks by Service | Displays the number of attacks for the service(s) within the specified time frame. | Bar Chart |
| Report can be drilled down by:
|
| Attacks by Hour | Displays the number of attacks attempted during each hour of the specified day. | Bar Chart |
| None |
| Attacks by Day | Displays the number of attacks attempted during each day of the specified month | Bar Chart |
| Report can be drilled down by:
|
| Top-Attacking Clients | Displays the number of attacks from the client(s) within the specified time frame. | Bar Chart |
| Report can be drilled down by:
|
| Top-Attacked Domains | Displays top-attacked domains based on the requests received. | Bar Chart |
| Report can be drilled down by:
|
| Top-Attacked URLs | Displays top-attacked URLs based on the requests received. | Bar Chart |
| Report can be drilled down by:
|
| Blocked Requests by Services | Displays the number of requests blocked by each service. | Bar Chart |
| None |
| Flagged Requests by Services | Displays the number of requests allowed by each service. | Bar Chart |
| None |
Attacked Services by Hour | Displays the number of attacks on services for each hour of the day. | Bar Chart |
| None |
Top Attacking Region/Country | Displays the number of attacks from different countries within the specified time frame. | Bar Chart |
| Report can be drilled down by:
|
Examples:
Attacks by Service Report:
Top-Attacking Clients Report:
Top-Attacking Region/Country Report: