

The Barracuda Web Application Firewall now supports log forwarding to Azure Log Analytics using the Azure Monitor Agent (AMA). AMA is Microsoft’s recommended replacement for the legacy OMS (Log Analytics) agent, which is no longer supported by Azure Log Analytics Workspace.
This enhancement ensures compatibility with Azure’s latest monitoring architecture, while offering a more secure and efficient way to export the Barracuda Web Application Firewall logs. You can configure this under ADVANCED > Export Logs > External Log Servers by selecting Azure Log Analytics Server (AMA Connector) from the drop-down list. Once configured, log events are sent as custom logs to Azure Monitor Agent.
For more information about AMA, refer to the Microsoft Documentation.
To configure or migrate to Azure Monitor Agent (AMA), follow the appropriate steps based on your scenario:
If you intend to set up AMA as a connector, follow the instructions in amaconnector.
If you are migrating from the legacy OMS agent to AMA, proceed with the instructions provided in migrateomstoama.
Configuring AMA as a Connector
Step 1. Deploy Azure Components Using the Template
Use the Barracuda Web Application Firewall custom template and deploy the following Azure components:
Log Analytics Workspace
Barracuda Custom Logs Table (barracuda_CL) in the Log Analytics Workspace
Workbook in the Log Analytics Workspace
Data Collection Rules (DCR)
Perform the following steps to deploy the custom template and associate the Barracuda Web Application Firewall instance with the DCR:
Log in to the Microsoft Azure portal.
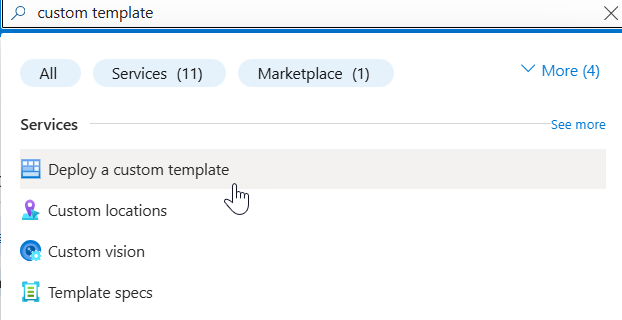
In the Search field, type custom template and select Deploy a custom template from the list.
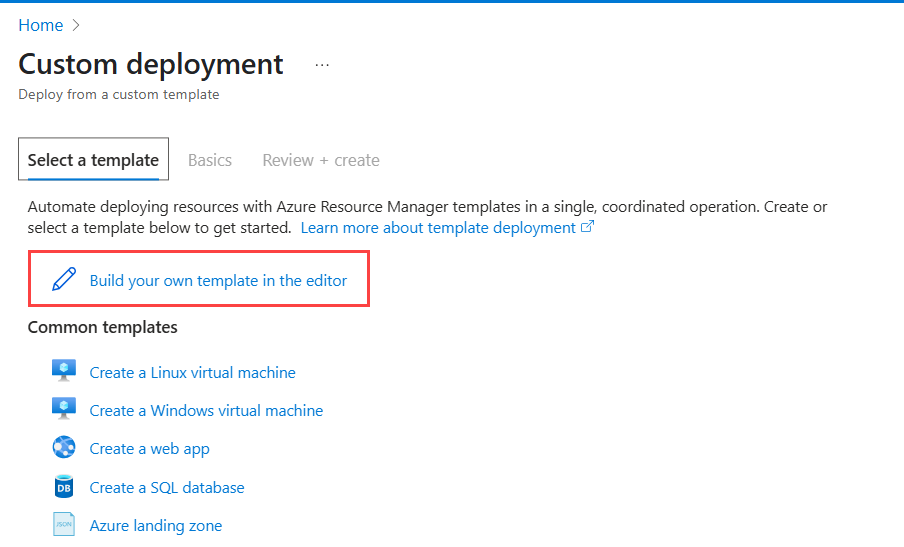
On the Custom Deployment page and click Build your own template in the editor.
On the Edit template page:
Clear the text area and paste the contents of Barracuda_WAF_Template.json
Click Save. The Custom deployment > Basics page appears.
On the Basics page, specify values for the following:
Resource group – Select an existing resource group or create a new resource group to associate the Log Analytics workspace. Note: If you select an existing resource group, the Log Analytics workspace will be created in the same Azure region as the selected resource group.
Workspace Name – Enter a name for the Log Analytics workspace.
Pricing Tier - Select pergb2018 as the pricing tier.
Type – Select Workbook from the drop-down list.
DCR Name – Enter a name for the data collection rule (DCR).
Click Review + create to create the workspace.
On the Custom deployment > Review + create page:
Review the details and click Create.
Once the file is created, it will create a DCR that specifies the Custom Logs file path, the schema of the logs and the custom table for log ingestion in the Log Analytics Workspace.
Go to the Data collection rules page:
Click on the DCR you created in step 4.
Expand Configuration and click Resources.
Click Add.
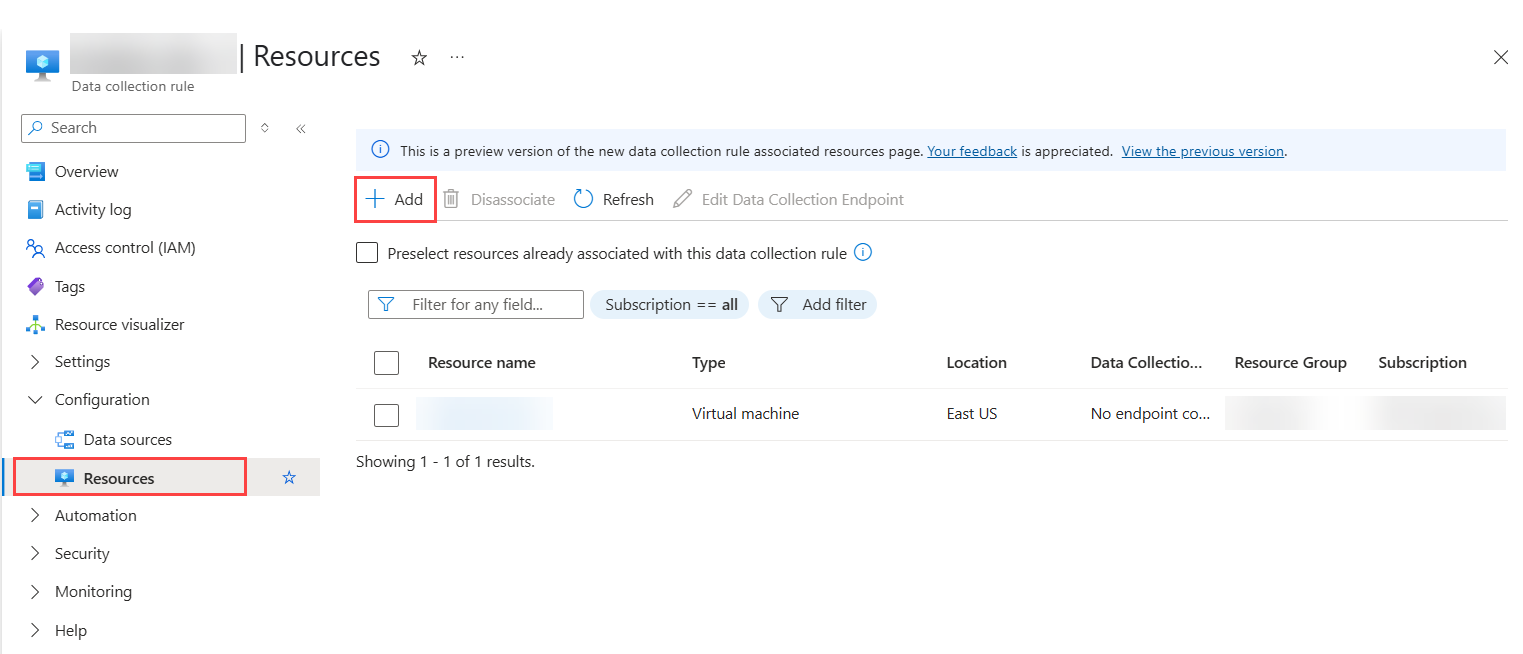
On the Select a scope window, search and select the Azure WAF VM instance.
Click Apply.
After the instance is added, the Azure Monitor Agent will be installed on the WAF, establishing the association between the WAF and the DCR.
Now, the Azure Monitor Agent collect logs from the JSON Log files located at: /mail/log/ama/ama_custom_waf_logs.json and sends them to the barracuda_CL table in the Log Analytics workspace.
Go to the Log Analytics workspace page and select Logs under your workspace.
Note: Log data may take approximately 5 to 10 minutes to appear in the workspace after the agent starts.Run the barracuda_CL query to see the logs.
(Logs will become visible once the AMA connector is added in the Barracuda Web Application Firewall web interface. To set up the AMA connector, refer to configureama.)Additionally, run the following query to check if your WAF is connected to the Log Analytics workspace using the Azure Monitoring Agent (AMA).
Heartbeat
| where OSType == 'Linux'
| where Category == 'Azure Monitor Agent'
| summarize arg_max(TimeGenerated, *) by SourceComputerId
| sort by Computer
| render table
Step 2. Configure the Workbook
You can either create a new workbook or update an existing workbook using the contents of the Workbook.json file.
To Create a New Workbook
Open the Microsoft Azure portal, navigate to your Log Analytics workspace.
On the workspace page, scroll down to the Monitoring section and select Workbooks.
On the Workbooks page, click New.
In the Editing query item section:
Click Advanced Editor.
Clear any existing content and paste the contents of the Workbook.json file.
Click Done Editing to apply the changes.
The graphs will now start populating in the workbook.
Step 3. Configure AMA on the Barracuda Web Application Firewall
Perform the following steps to configure AMA on the Barracuda WAF:
Log in to the Barracuda Web Application Firewall web interface.
Go to the ADVANCED > Export Logs page.
In the External Log Servers section, click Add Log Server.
In the Add Log Server window, edit the following settings:
Name: Enter a name for the log server.
Log Server Type: Select Azure Log Analytics Server (AMA Connector) from the drop down list.
AMA Log File Path: Path of the JSON file in the Barracuda Web Application Firewall instance where the log data is stored. The Microsoft Azure Monitoring agent uses this path to collect the logs and send them to the Log Analytics workspace.
Click Add.
Change the format for logs in the Logs Format section:
Syslog Header: Select Custom Header from the drop-down list and keep it blank.
Select Azure Log Analytics Server (AMA Connector) from the drop-down list for all logs (Web Firewall Logs, Access Logs, Audit Logs, Network Firewall Logs and System Logs).
Click Save.
After the Azure Monitoring Agent is configured on the WAF, the log files are generated in the JSON format.
Migrating from Microsoft Monitoring Agent (MMA/OMS) to the Azure Monitor Agent (AMA)
If you have configured OMS as a connector on the Barracuda Web Application Firewall and want to migrate to AMA, proceed with the instructions provided in this section.
Delete OMS Connector on the Barracuda Web Application Firewall
Perform the following steps:
Log into the Barracuda Web Application Firewall web interface.
Go to the ADVANCED > Export Logs page.
In the External Log Servers section:
Identify the OMS server and click Delete under Actions.
Click Ok to confirm.
After deleting the OMS connector on the Barracuda Web Application Firewall, choose one of the following configuration options based on your requirement:
Use an existing Log Analytics workspace
If you want to use an existing Log Analytics workspace, ensure that DCR-based custom log features are enabled for the workspace. See configloganalytics.Create a new Log analytics workspace
To create a new Log Analytics workspace, follow the steps mentioned in deploycomponents.
1. Configure Log Analytics Workspace to Support DCR Features
To migrate from OMS to AMA, you must configure Microsoft Monitoring Agent (MMA/OMS) Log analytics workspace to enable DCR-based custom log features. This setting allows AMA to write to any column in the table but disables OMS from sending data to the same table.
Download the bash script (Migrate Barracuda CL Table) to your local system and modify the following values in the script:
SUBSCRIPTION_ID - Specify the Microsoft Azure subscription ID linked to your Log Analytics workspace.
RESOURCE_GROUP - Specify the name of the resource group under which the Log Analytics workspace has been created.
LOCATION – Specify the location of the Log Analytics workspace.
Note: The specified region must match the region of the associated Azure Log Analytics workspace. If the regions differ, Azure Monitoring Agent will not function properly.LOG_WORKSPACE_NAME - Provide the name of the target Log Analytics workspace.
DCR_NAME - Assign a name for the data collection rule (DCR).
On the Azure portal, launch Cloud Shell from the top navigation panel of the Azure portal.

In the shell/terminal editor:
Click Manage files drop-down and select Upload.
Browse your system and select the bash file downloaded in step 1, and click Open.
After the file is successfully uploaded, run the following command to make the script executable:
chmod +x <FileName>.shRun the following command:
./<FileName>.shOnce the table migration, schema update and DCR creation is completed, the migration from OMS to AMA is complete.
Go to your workspace, expand Settings in the left panel and click Tables.
Locate the barracuda_CL table and confirm that Custom table appears under the Type column.
Go to your resource group and verify if the DCR rule has been created with the name specified in step 1.e.
2. Add AMA as a Connector
Perform the following steps to add AMA as a connector.
Log into the Barracuda Web Application Firewall web interface.
Go to the ADVANCED > Export Logs page.
Click Add Log Server.
In the Add Log Server window, edit the following settings:
Name – Enter a name for the log server.
Log Server Type – Select Azure Log Analytics Server (AMA Connector) from the drop-down list.
AMA Log File Path – Path of the JSON file in the Barracuda Web Application Firewall instance where the log data is stored. The Microsoft Azure Monitoring agent uses this path to collect the logs and send them to the Log Analytics workspace.
Click Add.
Change the format for logs in the Logs Format section:
Syslog Header – Select Custom Header from the drop-down list and keep it blank.
Select Azure Log Analytics Server (AMA Connector) from the drop-down list for all logs (Web Firewall Logs, Access Logs, Audit Logs, Network Firewall Logs and System Logs).
Click Save.
After the Azure Monitoring Agent is configured on the WAF, the log files are generated in the JSON format.