

The XDR Collector runs as a service in your environment. While the minimum specifications are listed below, the required resources depend on the number of active integrations and the amount of data being processed.
Install the XDR Collector on each server you want to monitor.
Minimum requirements
To set up the XDR Collector, the minimum requirements are the following:
| Minimum requirements | |
|---|---|
| CPU | 2vCPU |
| Disk Size | 10GB SSD |
| Memory | 1GB |
| Network interface cards (NICs) | 2 |
Operating System
- Ubuntu 22.04 (Recommended)
- For other versions, see the Elastic Agent 8.12.x row in the Elastic Agent table on this page.
IP Address requirements
Two private static IP addresses are required, one for each Ethernet interface.
Required Endpoint/Port Communication
The XDR Collector must be able to communicate to the following endpoints/ports:
Logstash | a96190b49bd294a5fbb3725ff20aab78-c7f64fe7557a87d2.elb.us-east-1.amazonaws.com:5044 |
Management Server | b5e9a5096e0a4f7782cc444c8edbbd5e.fleet.us-east-1.aws.found.io:443 |
Update Server | artifacts.elastic.co:443 |
Dedicated Host Requirements
Barracuda IDS/Suricata requires that the collector run in a dedicated host.
Setting Up the XDR Collector for Linux for Barracuda IDS
To set up the XDR Collector for Linux, perform the following procedures:
- To configure a static IP address
- To install the XDR Collector
- To set up switch port mirroring
- To edit the Suricata configuration
To configure a static IP address
- Configure a static IP address for each Ethernet interface. See Configuring a Static IP in Ubuntu.
To install the XDR Collector
- In Barracuda XDR Dashboard, click Infrastructure > Collectors.
- In the Policies table, next to the on-prem policy, click Action > Install.
- Click Linux.
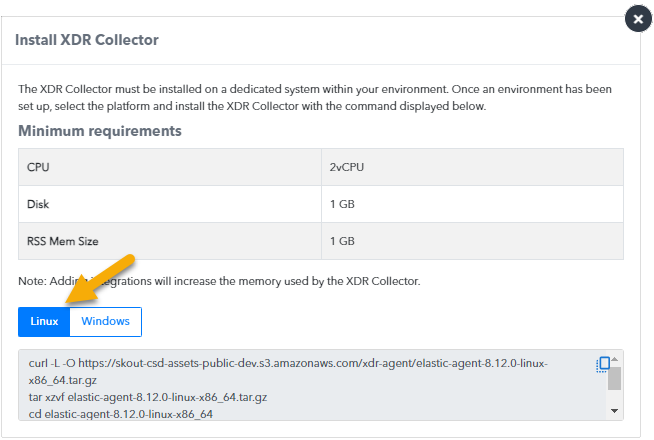
- Copy the command at the bottom of the dialog box.

- Open a terminal on the appropriate system, paste the command, and run it.
To set up switch port mirroring
- Connect the secondary Ethernet interface on the XDR Collector's host machine to the mirrored port on the switch.
- Configure the switch to mirror traffic in both directions on all other ports on the switch.
To install Suricata
- If using Ubuntu, add the Suricata repository:
sudo add-apt-repository ppa:oisf/suricata-stable - Update and install Suricata.
- For Ubuntu/Debian, run the following:
sudo apt-get updatesudo apt-get install suricata For RHEL/CentOS/Rocky/Alma/Fedora, run the following:
sudo dnf update -ysudo dnf install suricata
- For Ubuntu/Debian, run the following:
- Enable the Suricata service by running the following:
sudo systemctl enable suricata.service --now - Set the host machine's secondary interface in the configuration file, by doing the following:
- To open the suricata.yaml configuration file in Nano, open a terminal on the appropriate system and run the following command:
sudo nano /etc/suricata/suricata.yaml - To search for
af-packet, press CTRL+W. Next to
interface:, press the spacebar, then enter the secondary network interface.- To save the file, press CTRL + O.
- To exit, press CTRL + X.
- To open the suricata.yaml configuration file in Nano, open a terminal on the appropriate system and run the following command:
- To add the log rotate configuration, do the following:
Search for eve-log, press CTRL+W.
Add the filename and rotate-interval settings.
To update the stats interval configuration, do the following:
Search for stats, press CTRL+W.
Change the interval setting. The final format will look like this:
To create the log cleanup cron job, from the terminal open crontab with nano, do the following:
Type
sudo EDITOR=nano crontab -eAdd a cronjob which will run hourly and delete log files older than 90 minutes:
0 * * * * find /var/log/suricata/ -name "*.json" -mmin +90 -deleteTo save the file, press CTRL + O.
To exit, press CTRL + X.
- Restart the Suricata service by doing the following:
sudo systemctl restart suricata.service