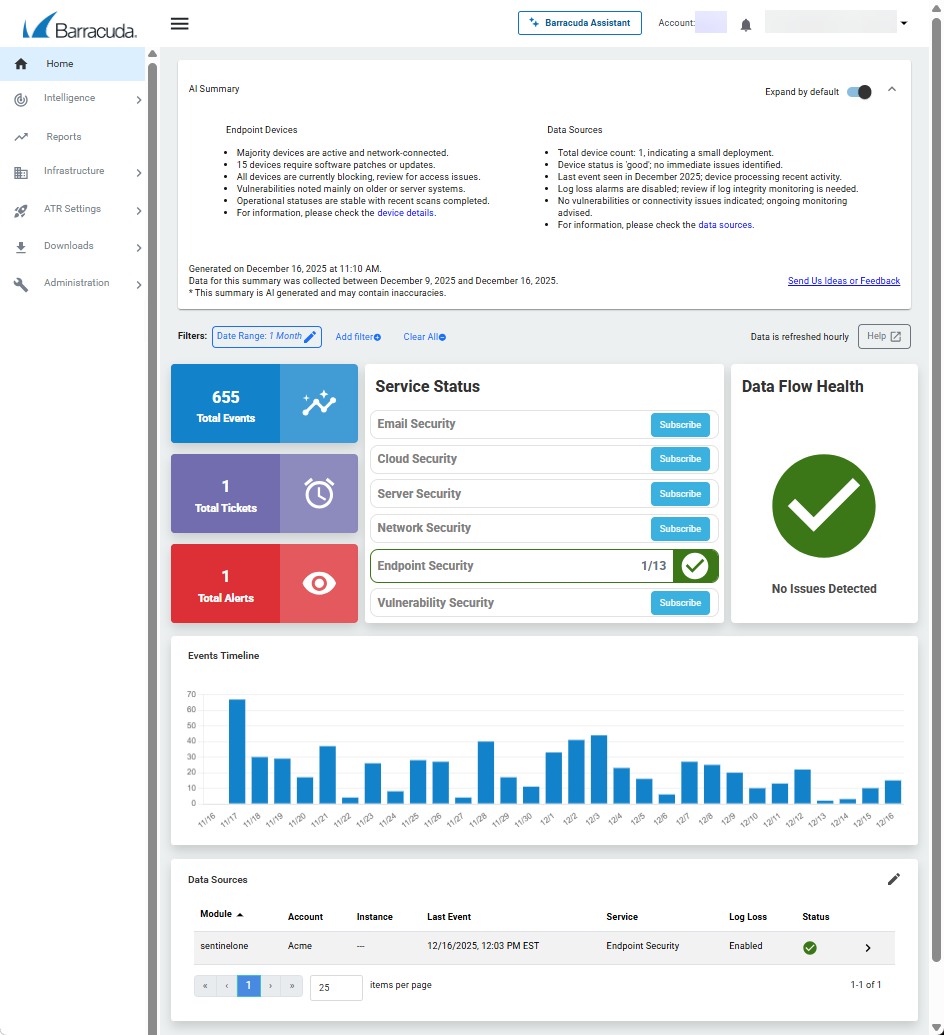
The Home Dashboard is your quick entry into your Barracuda XDR Dashboard data. On the Home Dashboard, you can see the following:
Total Events
Total Tickets
Total Alerts
Events Timeline
Data Sources
The Home Dashboard displays an overview of basic information that you can use to see the trends in events, alarms, and alerts. It also displays an easy-to-read graph of the trends in events over time and a table of the data sources managed by XDR.
Monitoring service status
The Home Dashboard provides all the tools you need to monitors your service status. Service status is the health of your data flow and data logs. For more information, see Monitoring Service Status on the Home Dashboard.

On the Home Dashboard, you can do the following:
