The Data Sources table at the bottom of the Home Dashboard displays information about the available data sources. You can use this table to identify and monitor the health of your data sources.
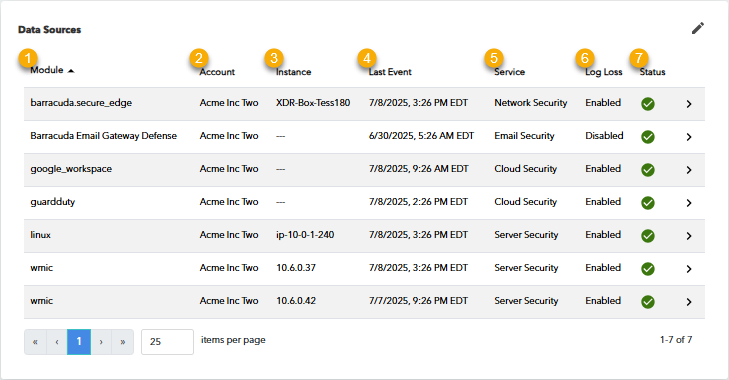
By default, the Data Sources table displays the following:
The data source module
The account the data source belongs to
The instance of the data source
The date and time of the last event (alarm or alert) received for the data source
The type of service, if known
Whether a log loss alarm/log degradation threshold warning is enabled or disabled
Whether the data source is communicating correctly.
If the data source is communicating, the Status column displays the following icon: .
.
If the data source is not communicating, the Status column displays the following icon: .
.
If the data source is communicating sporadically, the Status column displays the following icon: .
.
You can customize the display of the Data Sources table by sorting by module name, editing which columns are shown, and changing the number of items shown on each page.
To sort the Data Sources table by module name
You can sort module names from A-Z or Z-A.
In Barracuda XDR Dashboard, click Home.
Scroll down to the Data Sources table.
Click the arrow next to the Module heading:
 or
or 
To edit which columns are shown in the Data Sources table
In Barracuda XDR Dashboard, click Home.
Scroll down to the Data Sources table.
Click the pencil icon
 in the table header.
Select the check boxes of the columns you want to show.
Clear the check boxes of the columns you don't want to show.
Click Save.
To change the number of rows displayed on each page of the Data Sources table
In Barracuda XDR Dashboard, click Home.
Scroll down to the Data Sources table.
Select a number in the items per page field.