

The Endpoint Security page displays the number of devices affected by events, open threats, and mitigated threats, as well as the Threat graph and the All Threats table. You can use the tools on the Endpoint Security page to focus your data, making it easy to find the information you're looking for.
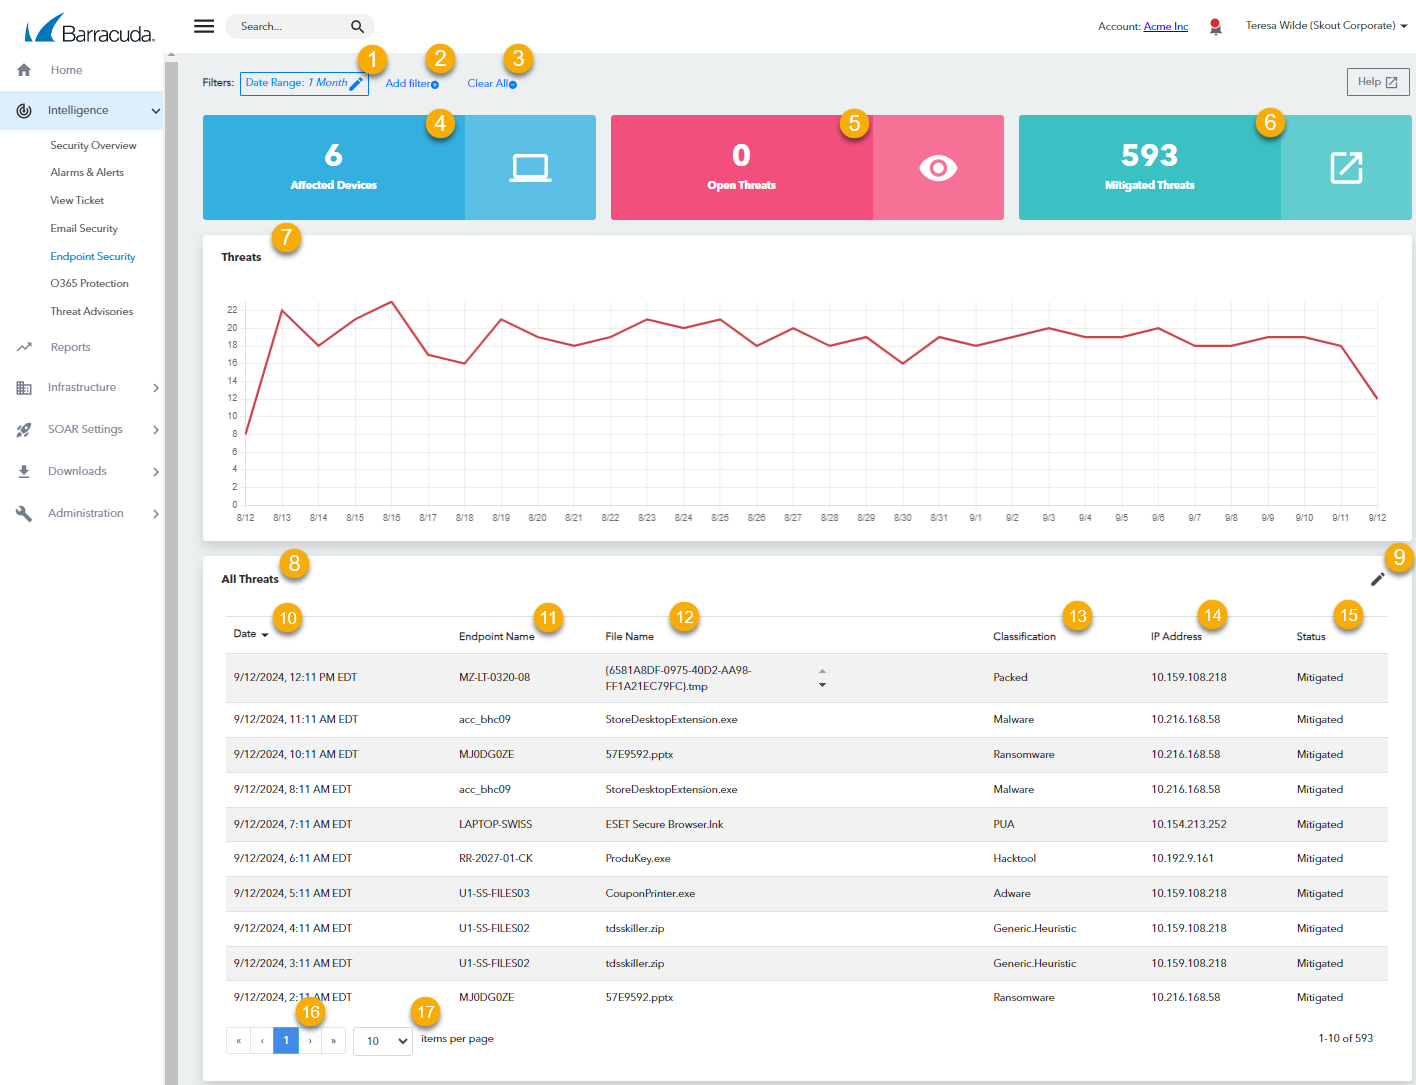
Click to edit a filter.
Click to filter this page. See Filtering the Endpoint Security Page and Changing the Date Range on the Endpoint Security Page.
Click to clear all filters from this page.
Displays the number of devices affected by threats, in the date range you choose.
Displays the number of open threats.
Displays the number of threats that have been mitigated.
Displays a line graph of threats by day.
Displays a table of threats. Click a threat to view detailed information or add the threat to the allow list. See Viewing Detailed Information on Endpoint Security Events and Setting Up an Allow List.
Click to edit the columns displayed in the table. See Exporting the Endpoint Devices Table.
Displays the date of a threat.
Displays the name of the endpoint affected by a threat.
Displays the filename of the threat.
Displays the classification level of a threat.
Displays the origin IP of a threat.
Displays the status of a threat.
Click the forward or back arrows to navigate the pages.
Click to select the number of devices displayed per page.