

Service status visualizes the different XDR products and what Integrations are available. Service Status communicates where XDR could provide more security coverage. Each service displays how many things you can monitor and how many you are monitoring.
There are two reasons a Service Status will get into an error state:
- There is a data flow issue, which will also show in the Data Flow Health area. This reflects data that was flowing into the XDR platform is now experiencing some sort of outage.
- You have not configured any integrations for a licensed product. This reflects an onboarding state for the respective product and will shows the customer if they need to perform actions to get the data configured.
You can monitor Service Status in the following areas on the Home Dashboard:
- Service Status
- Data Flow
- Data Sources
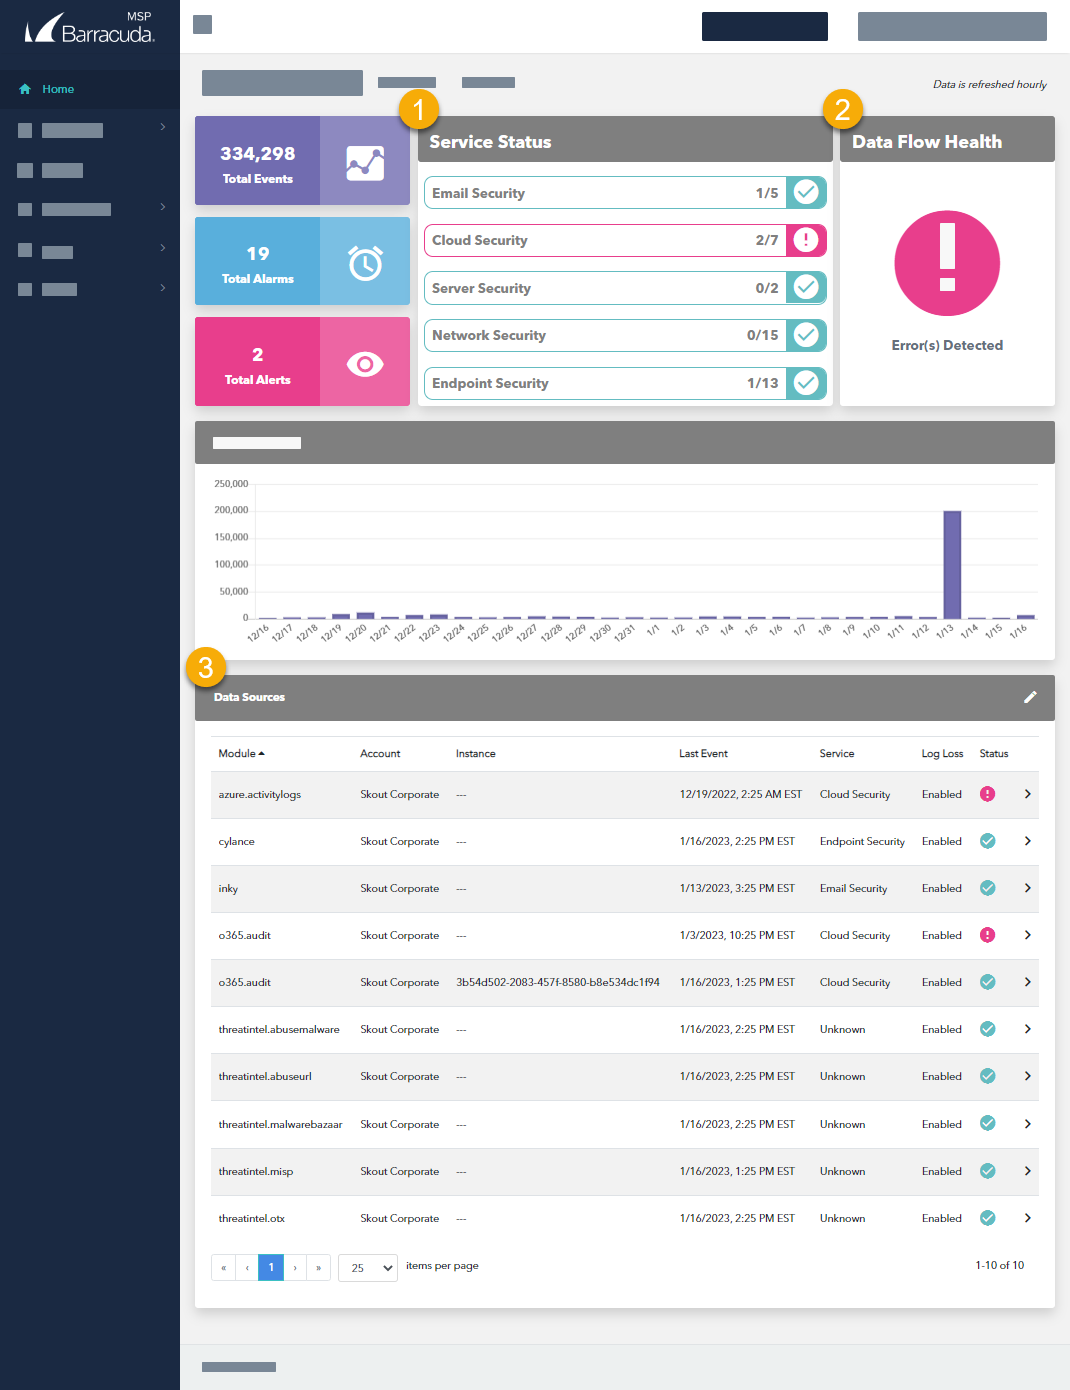
- The Service Status area displays the types of Security services, and indicates if any are in an error state.
- The Data Flow Health area indicates if there are any data flow errors.
- The Data Sources table displays the various data sources and indicates if any are in an error state.
To get more information on a data source
- In Barracuda XDR Dashboard, click Home.
- Scroll down to the Data Sources table.
- Click any row in the Data Sources table.
For more information on the Data Sources table, see Using the Data Source Table on the Home Dashboard.
You can also do the following on the Home Dashboard: